Wednesday, October 31, 2007

S&P/Case-Shiller

The latest data from the S&P/Case-Shiller home price index were released yesterday, showing continuing weakness. I have produced a chart from the data, both the index (red line) and the annual percent change (blue line). Click to enlarge.

Data: S&P

From January 2000 to August 2007 (latest data) the total rise in home prices was 114%, i.e. house prices more than doubled on average. In the same time, CPI inflation rose a total of 22.3%. In the next chart we can see how much faster real estate prices (blue line) rose in the US versus inflation (purple line). Obviously this sort of real estate overpricing cannot persist, but the relevant question is: how will the balance be restored?

The mildest scenario is that real estate prices will gradually ease and then flatten out for a long time, giving inflation a chance to catch up. Given what we already know about mortgage defaults and MBS prices, this is highly unlikely. After the ongoing decline in housing transaction volumes (existing home sales and new construction) the next step will be significant price declines; as we know, in markets price follows volume. A hint came from Mr. Mishkin's paper mentioning a possible 20% decline in house prices, even if this came in the context of a monetary policy model.

Another scenario is to engineer a much faster increase in inflation but, as the chart makes clear, this is impossible given the size of the re-adjustment necessary. Anything that even approaches this rate of inflation acceleration would destroy the US economy and the value of the dollar.

So, what is likely to happen? In my opinion, prices will initially break from a combination of bank auctions, builder inventory clearances and speculators rushing to the exit doors. We have hints of the size of this initial price drop from isolated auctions already taking place: as much as 30% off from peak prices. I think that banks will soon feel ecstatic if they can recoup 75% of their loan principal and will increasingly pressure the market downward, in a rush to be first out of the door. (This is what the various ABX indexes are already telling us, by the way.) The second chart also shows that the pressure will not be contained to houses bought in the peak years of 2005-06, because the massive price imbalance vs. inflation started in 2000 - in effect, it is possible that even people who bought houses as far back as 2002 will be negatively affected, particularly in the areas that spiked up the most in price (CA, FL, NV, etc).

Thus, I see a 20-30% initial "break" and then a long period of price under-performance, perhaps lasting as much as a decade that will restore house prices to levels reflecting their utility as homes, rather than trading sardines.

Tuesday, October 30, 2007

What Do DAP and CDOs Have In Common?

Before proceeding with the main subject of this post, I see that many people are still surprised by the ongoing tumble in the AAA-AA tranches of the ABX indices. I explained why this is happening a week ago in "Remember The Buckets".

Simply put, their terrible performance is not a matter of market psychology but mathematical fact derived from their cascade structure. As borrowers default on monthly payments, the small, lower tranches absorb the losses and leave the much larger AAA-AA portions intact. But once the process inexorably moves to seizure, eviction and auction, loan losses mount exponentially because the hits now come from far larger principal losses, not just interest and amortization. The lower tranches immediately become overwhelmed and spill over the entire losses onto the AAA-AA tranches, which make up 80-85% of the CDO amounts.

Let's look at the 2006-1 series of ABX, which is the oldest and most "seasoned", meaning the loans in the underlying CDOs had the most time to settle down. Think of the following charts as a series of buckets from top to bottom, successively filling up with losses and spilling over into the bucket below: BBB- spills into BBB, then into A, AA and finally AAA. Notice the time lag as the BBB- and BBB buckets first "fill up" with losses and then the "break" in the higher rated A and AA tranches, as the big principal losses suddenly spill over into them.


The AAA tranche is still holding up, relatively speaking, exactly as we expect. In this most seasoned series, the AA and A tranches are now taking the hits, with the expected time lag. But it won't be long before the AAA is all that is left...
Do the math... including the origination, pooling and underwriting fees that were originally charged to principal and the fees involved in their ongoing maintenance, I won't be at all surprised to see some formerly AAA-AA CDOs going for a panicky 50 cents on the dollar. If that.

Which brings me to today's subject: delayed consumer goods inflation. First some data; price increases from last year, spot month futures.

Soybeans: +76%
Corn: +66%
Wheat: +60%
Oats: +57%
Milk: +50%
Barley (i.e. beer): +50%
Rice: +33%
Coffee:+20%

Crude oil: +53%
DAP (di-ammonium phosphate fertilizer): +69%

Dry bulk cargo shipping rates: +350% (it's not a typo)

What do these prices have to do with CDOs? Nothing, except that raw material price hikes also follow a cascade structure until they reach the consumer, i.e. it takes time for them to be manifested in our local supermarket. At first, wholesalers may work off their cheaper inventories and absorb some price hikes to keep customers happy. We can view that as the equivalent of safety reserves and equity tranches in the CDO structures. Next come the large food processors, who may also abstain from passing the entire price increases to consumers, accepting instead some profit margin erosion to maintain market share. We can view that as the mezzanine tranche. For example, crude oil is at $93/bbl, but gasoline is still retailing as if it were at $70. Refinery margins are horrible, right now.

But once the various inventory, delivery and crop cycles are completed, the merchants and processors will have no choice but to pass the full price increases to the consumer, creating a sudden spike in consumer prices. If the consumer then balks and goes on a consumption freeze (as he will, unless his income rises faster) it will be corporate profit margins that will get squeezed hard. Until recently the consumer could count on easy borrowing to meet extra expenses and sustain price increases to fatten corporate profits; this is obviously no longer the case.

Consumer Food Price Inflation Chart: St. Louis Fed

In my opinion, we are already at the first critical point: price hikes for food commodities are being passed on to the consumer (chart above). We can also observe profit margin squeeze, e.g. WalMart's recent decision to cut prices on thousands of toy and other discretionary items.

The next 2-3 weeks will show if this year the consumer will snub the pre-holiday shopping ballyhoo and simply wait for retailers to panic and slash prices a week before Christmas. I know that's what I will do...

If this happens, you can bet that retailers and wholesalers are going to blow it all back to their suppliers/manufacturers in the form of smaller orders AND demands for lower prices, or at least a freeze. This is when China is going to feel it and given their tremendous overextension in manufacturing capacity and thin profit margins, I strongly believe they are headed for a heap of trouble.

Monday, October 29, 2007

Upcoming FOMC Meeting

With the next FOMC meeting almost upon us (Oct. 31st), a review of the dollar LIBOR money market yield curve(s) is in order. See chart below, click to enlarge.

A week before the Fed's last 50 bp cut the curve was ugly (red line), with a huge 60 bp spread between o/n and 1m rates. The market thus pushed the Fed into doing a rather embarrassing full monty, discussed in a previous post. The curve immediately normalized (blue line), saving speculators tens of billions in losses. As we learned a bit later, the decision was not exactly reached in splendid academic and institutional isolation.


Data: BBA
What do the curves tell us about the current situation?

There is presently no immediate short-term funding abnormality in the interbank market (yellow line) and from this perspective alone the Fed could sit tight, particularly with inflationary pressures increasing daily (oil is at $93/bbl today). However, the very same curve tells us that this is not how the market perceives things: it is steeply inverted past the 3m period, meaning the market is betting more rate cuts will be forthcoming soon. The 12m rate is a full 40 bp below the 3m rate and, even more significantly, 20 bp below o/n, which is Wall Street's rather unsubtle way of trying to force the Fed's hand once more.

Should the Fed oblige? The answer is a matter of opinion, depending on how one views the role of the central bank. During the Greenspan years the Fed established a pattern of paying close attention to market signals and acting in close co-operation with Treasury Secretaries, who also came mostly from Wall Street. That modus replaced the prior, slightly antagonistic ''push me - pull you" balance that existed between the Fed and the executive branch. The friendship and professional esteem between Mr. Greenspan and the Secretaries/Wall Street played a decisive role in generating mutual trust, so that monetary policy decisions could somewhat objectively rely on market signals. For the most part the scheme worked well.

But the playing field is entirely different today. First of all, markets are no longer acting as signals for the economy; instead they have largely become the economy, wholly dependent as it is on asset prices. And while real estate prices may not be readily manipulated, financial markets have increasingly become prone to institutionalized "steering". Some say that markets are too large for this to happen, but size is not the decisive factor today. While markets are certainly larger than ever before, their control has also become highly concentrated. M&A activity has created financial titans in banking and fund management and the spread of structured and derivative products has allowed for increased operating leverage.

In the past, "cash" markets (i.e. plain stocks and bonds) directly affected and controlled their thinner and more volatile derivatives; today the reverse is true: derivatives markets can be larger, deeper and in many cases more cost efficient to do business in than their referenced primary instruments. The tail can easily wag the dog and, from all appearances, it frequently does. Furthermore, it is not just the "pure" derivatives that matter; there is a whole slew of engineered products like index trackers, contracts for difference, financial betting, ETFs and structured bonds that act, or can be forced to act, as derivatives.

For example, unlike a plain vanilla index mutual fund that buys or sells shares depending on investor inflows and redemptions (i.e. tangible money flows), a tracker is forced to buy or sell shares depending on the performance of its benchmark alone. There are now literally thousands of such obligatory correlation trades that happen daily, throughout all asset classes. What is more, derivative trading is concentrated amongst just a handful of sophisticated investment banks and their leveraged customers, i.e. hedge and private equity funds. In other words, the game is being gamed to a greater extent than in the past.

I am thus of the opinion that the Fed - and all other central banks - should be cautious; they should carefully analyse and question the provenance and validity of all market signals, as they may no longer be as impartial as in the past. To draw an analogy, the cries of "wolf" may now be originating from within the wolf pack itself, waiting in ambush for the rescue party.

It is all too easy for a new Fed chairman to get sandbagged by Wall Street, particularly at a time when its leaders reign supreme over the economic and political affairs of the nation. However, I honestly hope that Mr. Bernanke appreciates that his authority ultimately derives from a much broader base of citizens. As a public servant, his primary duty is to ensure their continuing economic welfare and not to shelter special interests from their own avarice.

Friday, October 26, 2007

How Sudden Was The Debt?

The title of this blog is obviously a play in words, but it also points out a very troubling fact: people got into a lot of debt, very fast. How fast?

Here is a chart that shows exactly that (click to enlarge). It plots the annual rates of growth in household debt and personal income. They both grew at the same rate, more or less, until 2000 and then diverged very sharply, with debt rising in double digit rates and incomes trailing badly. This debt - income "gap" has persisted for a long six years and finally seems to be abating in 2007 (based on 6 month data projections).

Data:FRB

No mystery about what happened: homes used as piggy banks and the asset economy - instead of higher incomes generated through an expanding production base. The negative effects of this 2001-2006 gap are going to be with us for a long time, pressuring consumption and investment. The gap will also produce rising and persistent debt defaults, since the debt/income imbalance was so large and so long-lasting.

There is also no mystery about how this dangerous situation can be overcome; blue line significantly over the red line, for many years: i.e. personal income must rise much faster than debt, so that borrowers can comfortably service and gradually reduce their overextended debt load.

How can this be accomplished? Certainly NOT by creating another debt-induced asset bubble (stocks, commodities, whatever...). This will only make the two lines diverge again and the subsequent correction will be that much more painful, because -in the end - all debt must be serviced through earned income. Otherwise it all simply turns into a Ponzi scheme.


Thursday, October 25, 2007

Housing Takes It On The Chin - Again

Existing home sales in September dropped to the lowest level since the NAR started keeping records in 1999. Not exactly a surprise.. But that number does not tell the whole story. What matters most to the economy is not so much the number of homes sold, but their dollar value. So I produced a couple of charts for existing and new home sales tracking gross dollars instead of units.

First, the new home data (click on the chart below to enlarge).

Building new homes has gone from being a $400 billion/year business, to one doing around $225 billion/yr and dropping fast (red line). More worrying still is that builders can't get rid of inventory yet, which is stuck at around $150 billion (at average prices). The result is that the Inventory-to-Sales ratio (blue line) has rocketed from 0.35 to 0.65. I don't know of many, if any, businesses that can long withstand a doubling in their inventory/sales ratio. There is more trouble ahead for the home-builder sector.

Next, the data on existing home sales.

The NAR provides free data that go back 12 months - historic data are "available for purchase" (mind, I'm not complaining; everyone's entitled to a living - including brokers). But even so, they tell the story.

Here, we are dealing in the $$ trillions. In just 12 months existing home transactions have shed $400 billion in annual turnover (red line); that has to hurt mightily everyone involved. This translates to lower commissions, closing costs, loan points, purchases of new appliances and furniture, moving fees, etc. Data: NAR

The inventory of existing homes for sale is currently valued at $1.1 trillion (average prices, green line) and the Inventory-to-Sales ratio has jumped from 0.55 to 0.88 in just 9 months (blue line). While the higher inventory is not exerting the same kind of pressure as unsold new homes put to builders, it is still a significant drag on economic activity. People who can't sell their homes as fast and/or for as much as they originally calculated, are not likely to go out spending freely - the "wealth effect" turns around 180 degrees, particularly if their homes were used as HELOC piggy banks.

____________________________________________
"New Home Sales Unexpectedly Rise" (!!!!!)

This is one of the most shamefully spun headlines I have ever seen in financial reporting. They must think we are beyond stupid and well into moron territory.

The facts: Sales for September came in at 770.000 units, exactly as expected. August was originally reported at 795.000, but with today's report they were revised down significantly to 765.000. So this loss of 30.000 units was reported as a... rise!

Tell you what: let's permanently cut the reporter's salary by $35.000 in October, but then give him a $5.000 "raise" in November. How happy is he going to be about this "unexpected rise"?

This is getting Orwellian.

Wednesday, October 24, 2007

Quant Quandary

Hedge funds pulled in $45 billion in new money during the third quarter of 2007, bringing the nine month total to $164 billion vs. $126 billion for the whole of 2006. That's impressive and goes a long way in explaining why markets - particularly emerging markets - are performing the way they are. People are still throwing tons of high-powered money at them. I say "high-powered" because hedge funds can and do leverage, sometimes as much as 50-to-1, depending on their strategy. So one dollar raised may end up as twenty dollars in Brazilian shares. Furthermore, we now have funds of hedge funds becoming very popular, further hiking total leverage (ding, ding, ding - does anyone hear the alarm bell ringing? Read your financial market history, folks. Hint: trusts of trusts in 1929).

Total assets for hedge funds reached $1.81 trillion. And therein lurks a serious quandary for quant hedge funds, who depend on being nimble and highly specialized. For example, if a manager identifies a discrepancy or mis-pricing in a market he may put on a spread trade to capture the difference with seemingly little risk. However, as more and more managers identify such opportunities the pickings become slimmer - the law of lower marginal returns sets in. Typically a manager then has two choices: find another opportunity, or hike leverage on his existing trade to make up for the smaller profit margin.

With so many hedge funds now scrutinizing the entire world for relative value trades, new opportunities are not easy to find. So, I bet what is happening is this:

a) Leverage is being increased on existing trade strategies and,
b) Funds are increasingly taking outright positions, i.e. becoming net long or short, exposing themselves to the full force of the market, instead of putting on spread trades.

Why do I say this? Let's see...
  • The equity arbi funds that take spread positions based on LBO/takeover transactions can't be doing well. The pipeline has run dry and existing deals are either getting re-priced or cancelled altogether. There are big losses simmering there...
  • The SIVs and other conduits borrowing short-lending long are dead. All other hedge funds that followed the same strategy are in trouble, too.
  • The CDS-equity correlation party is over, too. Broad equity indices are near all-time highs, but corporate CDSs are nowhere near as cheap as before. Risk is now being "re-priced", to say the least.
  • One of the only games left is one of the oldest: momentum trades. In other words, identify a market(s) that is trending strongly and join the party. And guess what? This is exactly what is happening: you can see it in the way that bullish markets extend and extend, be it Chinese stocks or crude oil.
Bottom line? It seems to me that quants are not being as conservatively "quantish" as before... Loaded with new money to "invest" (as Alan Greenspan famously said about wild-eyed speculation before the dotcom crash, "is that what we call it now?") and fewer arbi/spread opportunities, the money must increasingly be going to outright speculative positions.

Add increased leverage and what we have going on here is bubble pumping in spades.

Oh, and I forgot to mention... Anyone still thinking that hedge funds are the playground of the rich and famous is woefully behind the times. ANYONE can buy into a hedge fund these days - some with as little as $10.000: i.e. 100% retail investor stuff. This occurs through the aforementioned funds of funds and - no surprise - the biggest piece of the $45 billion raised in the 3Q2007 went to...funds of hedge funds. A cool $22.5 billion. Contrast that with the puny $990 MILLION raised by plain old mutual funds during July and August and you have yourself a trend, eh?

Did someone say the retail investor is absent from this bubble? Don't think so....

Tuesday, October 23, 2007

Still At Work, But Not For Long

One puzzle that even Fed presidents find difficult to solve has to do with construction jobs. Though new housing starts have plunged, so far there have been no massive layoffs in the sector - at least not as measured by the BLS (see chart below).

Employment in residential building construction (seasonally adjusted) Chart: BLS

The two explanations that I hear most often have to do with (a) illegal, undocumented aliens not being counted and (b) switching work to commercial construction. Both are correct to a certain extent, but: (a) I find it hard to imagine that the proportion of jobs held by aliens was very much higher in 2006 than, say, 1988-90 and (b) the BLS does not show a commensurate increase in the number of jobs for the non-residential construction sector - employment there is flat. Plus, the number of jobs in the housing construction sector doubled since the last major housing recession in 1992, in line with housing construction activity (see chart below). So, the puzzle remains...


The answer to the puzzle is much simpler, I believe. Unlike other housing recessions, this time housing starts fell off a cliff from a record high level - everything happened very, very fast. This means that there was still a lot of work to be completed at the time. Now, a builder will not abandon a project in the middle of construction - he has already invested too much money. Knowing that things are turning negative on the demand side, what he will do, instead, is rush every worker available to the sites already in progress, in an effort to complete and sell as many houses as possible, as soon as possible. This is the logical reaction to a dropping market: houses that come late to the market will fetch lower prices. Look at the chart below (click to enlarge): starts have plunged, but units still under construction are high. This can only mean that builders are working hard to finish existing projects already in the pipeline. And that's why construction workers are still at work.


But what the future has in store is another matter altogether. Given the collapse in starts, construction layoffs are going to occur suddenly, too, just as soon as work in progress is finished. And that's when we may see half a million jobs disappear within months.


ADDENDUM: When will the job losses happen?

First a chart - you definitely need to click on it to enlarge and study it. Too many squiggly lines.

The top two lines are starts and completions; they track quite closely, meaning that builders are completing what they started and not really abandoning many projects.

The next two lines present somewhat of a puzzle. The blue line is sales and the pink one units under construction. After tracking for decades, as one would expect, after 1996 sales overtook construction significantly. What happened? It must be that cancellations became a significant factor (figures for sales are reported when contracts are signed and do not adjust for subsequent cancellations).

The green line at the bottom is the most interesting of all: new houses for sale. They are stuck near all time highs, meaning that inventory is a big problem.

OK, let's put it all together, from the jobs viewpoint:

a) New construction activity (starts) is collapsing. Future employment will decline.
b) Sales are approaching the number of units under construction, after being significantly higher. Builders are building fewer buildings, but sales are dropping faster.
c) The result is that inventory is not coming down. Builders will have to do fire sales and cut costs - i.e. cut jobs soon.

When and how much? Given the last three months data on starts, units under construction will probably drop to the 575.000/yr. level by year-end (September was at 675.000). This level is the same as in 1998, when residential construction employment averaged 725.000 jobs (September was at 981.000). So I project a loss of ~ 250.000 construction jobs in the next three months. Furthermore, starts currently are at 1993 levels, when employment was at 580.000 jobs and it seems to me we will drop to that level within another three months, for a total of 400.000 jobs lost in six months.

If starts keep going lower then construction jobs will drop even further.

__________________________________________________________________

With all thy knowledge, get going...

I added a strip of finance/economics book recommendations to the right of the blog. I will update them from time to time.

Monday, October 22, 2007

Remember The Buckets

As the mortgage crisis unfolds, I think it is useful to remember that most mortgage-backed structured finance products use a cascade configuration. Practically, it takes some time until defaults are reflected in the cash flows of the AA and AAA tranches, because the first "hits" are taken against the lower-rated "buckets" and against whatever reserves were maintained as a cushion. From the perspective of the AA-AAA CDO holder, nothing has changed in his cash flow: he/she is still getting paid regularly.

What this means is that, absent a functioning secondary market, holders resort to mark-to-model to price their portfolios; since the cash flows are still unchanged for the AA-AAA tranches, models come up with high valuations. This explains why all concerned (banks, brokers and presumably hedge funds) took such relatively small write-offs on their CDO positions. But it also explains why holders of large positions in supposedly high quality bonds are in such a hurry to form the Super-SIV and get 'em off their balance sheets (but apparently no one else is biting). Because...

The big hits for the AA-AAA buckets are still in the future and they are not going to come from borrowers' missed monthly payments - that's just interest (mostly). As the process moves along from delinquency to default, repossession and eviction, the lower buckets may still be able to absorb some, if not all, of the losses stemming from lower monthly payments. The real crunch will come when REO auctions finally occur and the real estate is sold at prices significantly less than what is owed. That's when large principal losses will be realized, flooding the lower tranches and cascading in waves onto the AA-AAA buckets.

The sad truth is that there are no AA-AAA CDOs, not in the traditional corporate bond sense, anyway. Their structures make them inherently unstable past a critical point, after which their performance becomes non-linear on the downside. The banks know this very well (they engineered them, after all) and that's precisely why they don't want to hold them - it has nothing to do with lack of transparency or liquidity. Such products are large ticking bombs; their manufacturers can calculate with relative accuracy when they will explode, given timely data on delinquencies and defaults. As in any bankruptcy, how much money will be recouped will depend on the prices realized from the auctions, minus costs and fees.

That's why hedging via the ABX indices is becoming rapidly more expensive, even for the AAA tranches, and also why the rating agencies are finally starting to downgrade such issues by the tens of billions.
Chart: Markit


Saturday, October 20, 2007

The Debt Pie

Today, being Saturday, one chart: the make-up of the debt of the non-financial sector, i.e. that owed by households, the government and corporations - everyone except banks and other financial institutions. As of the second quarter of 2007, it amounted to nearly $30 trillion or 220% of GDP.

Data: Federal Reserve

What immediately stands out is the size - absolute and relative - of mortgage debt. Ultimately, this is the very reason why the bursting of the real estate bubble is real cause for alarm. A very large percentage (over 50%) of this $13.8 trillion in mortgage debt has been securitized and distributed widely in the US and abroad as mortgage pools, GSE securities, CMOs, CDOs, etc.

Therefore, the mortgage debt crisis is not an isolated risk event. It has the potential to shake the whole asset/credit economy from its very foundation and it will take much more radical solutions than band-aids (eg super-SIVs) to prevent serious consequences. It seems to me that this problem, just like peak oil and climate change, is going to end up being highly political and not merely technical or financial.

Friday, October 19, 2007

Complexity and Non-Linear Consequences

The Tower of Babel. Easter Island. Kurt Godel and Werner Heisenberg. A nuclear reactor. Innovative Finance. Rube Goldberg. Bread crumbs.

If the connections between the above references are not quite clear, allow me to explain.

The tower of Babel is one of mankind's oldest warnings about the destructive forces unleashed when complexity takes over. Interestingly, complexity was God's punishment. Think about that for a second: complexity as punishment! There is a lot of wisdom in The Bible.

Easter Islanders built a highly complex societal system for the purpose of constructing, transporting and erecting the famous moai statues dotting the shores of their island. They became so absorbed in this activity, that they eventually stripped the land of all resources and imploded.

Kurt Godel was the mathematical genius who proved that there are theories that can never be proven. Heisenberg took that idea one step further into the physical world with his Uncertainty Principle. In other words, there are things we do not know and which we will never know.

Pause: complexity is a necessary element in any social system. The question is, how much complexity is beneficial? How far do we go without eventually producing a tower of Babel? If we go too far in creating complex systems we reach a point where minute variations quickly result in disproportionate effects, like the butterfly in China creating a storm. Enter Godel and Heisenberg: we know that we will have unexpected variations, because we cannot know and control everything a priori.

Furthermore, the results may be catastrophically non-linear. The nuclear reactor is a perfect example: a small increase in the number of neutrons leads to an uncontrolled chain reaction. Another example is a chemical reaction that proceeds very slowly on its own until we introduce a catalyst, at which point it will run away and cause an explosion. Highly complex systems are prone to non-linear behavior; and the more complex they become, the higher the probability of critical, non-linear events.

Second pause: with "innovative" finance we have constructed the equivalent of a series of global financial nuclear bombs. We have sliced and diced every conceivable stream of income and variation from "norm" and re-packaged them into new "products". In previous posts I showed how a simple mortgage spawns third and fourth derivative products like CMOs, CDOs, CDSs, hubrid CDSs and CPDOs, each of them a step up in complexity and price volatility from the one before, all linked together in a tight relationship. The same has happened with equities, insurance receivables, energy, shipping... you name it, our financial engineers have taken it apart and put it back together like so many Lego blocks.

It looks to me that, after a point, all we have accomplished with "innovative" finance is the construction of a number of Rube Goldberg contraptions that end up doing very simple tasks through a series of inter-connected complicated and convoluted steps, each prone to its own risk of failure. Each individual risk may be small, but added together they can propagate toward total collapse. The risk is now in the system itself, not in the exogenous events.

Why have we done this? Because at each step there is "friction", aka fees and commissions. Crumbs, as Sherman McCoy from Bonfire of The Vanities would put it. But Tom Wolfe wrote his epic at a more innocent time, even though it was only 20 years ago. Today we are no longer content with the few crumbs that remain on the table. Instead, we as investment bankers, traders and speculators, grate entire loaves into bread crumbs, take out as many as we possibly can for ourselves and then put them back together for sale as bread sticks.

Thursday, October 18, 2007

Credit Risk Rising Again

Credit risk is being marked up once again.

The most pressure is building in mortgages. The ABX (residential) and CMBX (commercial) indexes are declining fast, many of them making new all time lows - including the highly rated tranches. There is obviously an increased push to hedge CDO inventory sitting in dealers' hands and various portfolios, SIVs included. Fresh downgrades from S&P and losses at mono-line insurers are also a significant factor, as is Cheyne's latest announcement about its SIV.

Some charts from Markit:

ABX: AA tranche for the latest 2007 vintage


ABX: BBB- tranche for the latest 2007 vintage


The CMBX charts, tracking commercial real estate loans, are inverted, i.e. they show yield spreads.
CMBX: A tranche

CMBX: BBB tranche

Repeat of August? Who knows, but just like then CDX spreads are slowly rising once more (corporate bond risk) and so are LCDX spreads (LBO loan risk). You can follow those on Markit's site, too. Doesn't look good.

Tuesday, October 16, 2007

Fishy Pols

Have you noticed how even Presidential races have now been reduced to dollar figures? I don't mean the effect that money has on shaping political agendas and voter perceptions - this has been going on since at least the time of Pericles. I am referring instead to the assessment of candidates' appeal to voters based on how much money they have raised in their election "war chests". Hillary is deemed to be the frontrunner because she has raised X million dollars more than Barack, who is ahead of John Edwards and so on and so forth. This is so much like the order book of an IPO (initial public offering), for chrissakes. The more orders that flow in during the book-building period the better the chances that the issue will be "hot" and open for trading at an immediate premium. Hillarydotcom and Barrackdotcom.

We have financialized everything, so I should not be surprised. But I still think it is troubling and, ultimately, very dangerous for the quality of our democratic process. Money cannot measure the quantity and certainly not the quality of political ideas and principles. Judging politicians by their fund-raising prowess is akin to judging fish by their price at the fishmonger's stand, instead of by how they smell. Spoiled tuna will send you to the hospital no matter what the price.

Monday, October 15, 2007

Super SIV? No: PBoC Policy

No. This post is not going to be about the Super-Sieve, the structure that will act as sinful banks' SIV Purgatory. Intelligent people with a modicum of market knowledge and experience can come to their own conclusions, always depending on their individual perspectives. All I can do is refer history buffs to the Borgia Pope.

On to other, more important news.

The People's Bank of China (PBoC) raised its reserve ratio yet again on Saturday, trying to control surging credit expansion and inflation. They upped it by 0.50% to 13% - the eighth such move this year and the thirteenth in a tightening cycle that started four years ago. Clearly, their determination to tighten money has become significantly more forceful recently. The chart below chronicles their moves since 2004.


We can immediately see the genesis-point of today's Chinese bubble: the two year period between 2004 and 2006 when PBoC maintained very low interest rates and reserve requirements. Cheap money resulted in massive capital investment, sucking in huge quantities of raw materials and further boosting cheap exports to the US, which was itself going through a rapid real estate, credit and consumer expansion. The dollar-yuan peg and low Chinese rates made US borrowing from China easier, to finance a ballooning trade deficit.

But PBoC is now moving in the exact opposite direction from the Fed: they are tightening, while the Fed is easing. Unless the US can rapidly increase its own saving rate to provide more domestic credit to the economy, borrowing from abroad is going to get less available and more expensive. And this at a time when the mortgage and LBO debt markets are themselves contracting.

This is the real news...the SIV to end all SIVs is public relations.


Saturday, October 13, 2007

Monkeys, Nuts and CDOs

Do you know how they catch monkeys in Asia? They make a box with a hole just big enough for the monkey's hand to fit through, put a lychee nut in it and nail it to the ground. The monkey shows up, pokes his hand through the hole and grabs the nut. But he can't get it out because his fist, holding the nut, is now too large to fit through the hole. The hunters come out of hiding with their nets, but the monkey does not flee - instead of letting go of the nut and running away, he just screetches in frustration as he tries to get his hand AND the nut out. In our business that's what happens to traders who hang on to losing positions. They can see the boom coming down on their head, but they just refuse to let go of their positions.

The same thing is happening to mortgage-backed paper these days. Defaults are rising, ratings are cut, market values keep coming down, but banks and hedge funds are stubbornly hanging on to their nuts. Bernanke cut rates and they took the SIV's onto their own balance sheets - and still there was trouble. The next ploy was to try and set up "separate" entities that would buy the paper from the banks at a slight discount, financed by the self-same banks. They call this an arm's length transaction, but it's their own arm inside the box holding on to the lychee for dear life. Now they are "negotiating" with the Treasury Dept. to find ways to revive the ABCP market.

Meanwhile, the market is clubbing away at their head. Week after week the amounts of ABCP outstanding are dropping and their yields are stuck high, while ABX indexes are melting away.


ABCP outstanding as of Wednesday, Oct. 10. (yellow line). Plunging still...

Charts: Federal Reserve


CP risk spreads have come down somewhat from their panicky highs, but are still very wide and getting sticky around 55-60 b.p. - unlike previous spike episodes. This is not comforting at all.


Absolute yields have come down, but once again ABCP rates refuse to go below where they were before the Fed's rate cut. For mortgage-backed traders/speculators those 50 bp never happened. Maybe the arbi desks will jump in and close the spreads, but... in which direction? Because if they end up also raising the rates paid by the financial firms (red line), it will be a Pyrrhic victory.


Even the newest vintages of ABX are weakening once again.

Chart: Markit


And how could they not? The real estate boom has turned into a bust, the economy is slowing and mortgages made under rosier-than-thou assumptions are simply not performing according to model. And they are certainly not performing as hoped.

Let go of the nut, Cheeta. That's not Tarzan you see coming at 'ya.

Friday, October 12, 2007

South Seas and China Seas

The South Seas Bubble (1720) is one of history's most notorious market bubbles. If you are not familiar with it, Wikipedia has an excellent entry on it, from which the following chart of the South Seas Company stock price is taken. Very smart people lost fortunes in the scheme (Sir Isaac Newton lost the equivalent of today's $4 million). The Company actually made little profit from trading goods and slaves with the Spanish colonies in South America - as was the charter of the Company. The bubble was formed, instead, when the company arranged to take over a large portion of England's public debt.

Ding, ding, ding...does this "arranged to take over a large portion of England's debt" ring a bell? Well, of course it does. The Seas are now further to the East, but the same elements are there: promises of riches from trade as a "hook", but the real money is made from speculating on financial assets.

Today's "China Syndrome" drives the following equation:

1.3 billion Chinese x (insert your product/service) = UPF (Unimaginable Profits Forever)

I close by providing a comparison chart, which I believe is quite apropos. It compares the monthly prices of South Seas Company stock from 1720 with today's prices of a cargo ship company stock listed in the US. I leave the name of the company out, for obvious reasons.


We can just as easily compare with a variety of other stocks... Chinese banks, for example.

__________________________________________________________________

PS September Retail Sales came in +0.6% vs. August, somewhat more than expected. Here is the breakdown:

Sales $Million

% Of Total

Weighted Change

Motor vehicle & parts dealers …….

78,653

20.69%

0.25%

General merchandise stores……….

48,526

12.76%

-0.01%

Food & beverage stores…………….

48,281

12.70%

0.10%

Food services & drinking places …

37,764

9.93%

0.00%

Gasoline stations ……………………

35,551

9.35%

0.19%

Building material & garden

29,541

7.77%

0.01%

Nonstore retailers …………………..

25,027

6.58%

0.07%

Health & personal care stores …….

20,197

5.31%

0.05%

Clothing & clothing accessories

18,936

4.98%

-0.02%

Miscellaneous store retailers ……..

10,396

2.73%

-0.04%

Furniture & home furn. stores ……

10,293

2.71%

-0.02%

Sporting goods, hobby, book & Music

7,565

1.99%

-0.01%

Electronics & appliance stores ……

9,500

2.50%

0.02%

380,230

100.00%

0.59%


Autos accounted for 0.25% out of the 0.60% increase. But the rest came almost entirely from gasoline (+0.19%) and food stores (+0.10%), which are actually indicators of accelerating inflation.

The more economically sensitive sectors, the ones that depend on discretionary spending like restaurants, clothing, etc., were flat to down. The consumer is not on a strike yet, but he is being extremely cautious.

And something else: food and gasoline combined account for 22% of all spending. Can we please stop this nonsense about "core" inflation?

Thursday, October 11, 2007

Let Them Eat...Whatever

This will be a very short post.

WalMart announced today that it will do slightly better earnings-wise despite mediocre sales (+1.4% for same stores) because it was able to cut costs. Other stores are not doing so well. Ho-hum.

But what about Wall Street? How does it see these news? My award for this week's crassest statement in the face of human misery goes to a Mr. David Abella, an analyst with Rochdale Investment Management LLC which manages $2.5 billion in assets, including WalMart shares.

``People still have to live their lives. It's not like somebody forecloses on their house, and then they just decide they're not going to eat that month.''

He really said that, look it up in Bloomberg - I am too sickened to provide a link. He doesn't care if people have no place to live, they STILL have to shop at WalMart where he is a shareholder.

For his children's sake - assuming that such a heartless man could attract a female long enough to procreate - I hope he never has to face the sheriff's deputies come to evict him.

My God... Has Wall Street sunk so low?

Tuesday, October 9, 2007

Dude, Where's My Bubble?

The 1999-2003 boom-bust in stocks and the more recent "event" in real estate has left most people thinking that markets always form and pop bubbles. "Where's the next bubble going to be?", is a common question these days, even by major-bracket investment house analysts. As I noted in a previous post, one of them even used the absence of a retail investor-driven bubble in US shares as a contrarian reason to recommend their purchase. Odd as it may seem, people seem to be hooked on bubbles.

Certainly, it's a big world out there and if you look at each market separately, across all asset classes and regions, then yes, there are bubbles and bubblettes forming and popping all the time. Last year the bubble in copper prices sadly caused people to be electrocuted when they attempted to steal high voltage transmission lines. A few months ago there was a bubble in the construction of corn ethanol distillation plants, which drove the price of corn higher. Severe droughts have caused a bubble in wheat prices. And there is a bubble forming in marine transportation shares, chiefly in bulk carrier companies.

But the biggest current bubble of them all is undoubtedly China - world class, global scale. I am not going to repeat what is going on there - we all know. I will isolate only two aspects:

a) The bubble in Chinese share prices is caused primarily by local ignorance of the very basics of investing and market economics. "China is in dire need of financial expertise", says Alan Greenspan in his new book and he adds, "...Chinese banks lack the professional expertise to judge what enables a loan to be repaid...To the extent that there are a lot of bum investments, part of the measured GDP is waste and of no value". These are very strong and direct warnings from a man who is otherwise famous for Delphic inscrutability and constant hedging of all pronouncements. (The Age of Turbulence, p. 307-308).

The fuel for this ignorance-driven bubble comes from the huge pool of hitherto stagnant bank deposits, formed after years of very high saving rates (40%+). After earning low rates of interest for years, they have now been unleashed unto the stock market. Well, as the saying goes, a few will make tons of money and the rest will, sadly, acquire "experience".

b) The PBoC is in a bind. After years of explosive monetary growth (20%+) which fortunately did not result in much inflation, China is finally and suddenly faced with two kinds of inflation at the same time: rapidly escalating consumer prices - chiefly for food - plus asset inflation in shares and urban real estate. They must have known it was coming (they have been raising interest rates and reserve ratios for months), but a pegged exchange rate removes the bite from their monetary policy bark. If China does not abolish the peg to fight inflation, it will eventually have to raise interest rates so much that will create very predictable negative effects for borrowers and banks.

In addition, if inflation is not combated right now, it will become embedded in peoples' expectations and result in constantly higher wage demands (structural inflation) - a clear problem for an export economy heavily reliant on labor cost arbitrage. With the "coming-out" Olympics due in 10 months, the political establishment may soon face a stark choice: a restless urban population squeezed by inflation vs. lower profits for business. If it comes to that, higher wages will win by a landslide - this is a country where communist roots are still very visible: Mao's portrait is on almost every banknote.

The Chinese government must allow the yuan to float freely, right away. China's is no longer a small, vulnerable and isolated economy; it is a major factor in the global economy and needs to adjust its currency accordingly. If it does not, it may soon find that politicians from the US and the EU will succumb to rising popular cries for the imposition of punishing import duties. The election cycle is a burdensome mistress, particularly if the domestic economy (eg in the US) is rapidly slowing down and scapegoats are needed.

Which takes us back to the "bubble" theme. So far China's authorities have not been effective in popping its asset bubble through half measures. I fully expect the next step is going to come soon and it WILL be effective.

So... there's your bubble. Don't go anywhere near it, unless you are the one carrying a big pin.

Monday, October 8, 2007

Assets , GDP and Debt

I have been saying ad nauseam that the US economy has become increasingly "asset-ized" and "financial-ized". A quick way to judge if an asset class is becoming overvalued against the economy's ability to produce goods and services is to examine the total value that assets represent vs. GDP, so without further ado here are a few charts.

First, the total value of stocks and Real estate vs. GDP for the US.


Data: FRB, World Federation of Exchanges
  • Total US stock market capitalization is now 151% of GDP, a percentage exceeded previously only during the bubble in 1999-2000. This ratio is double what it was in 1994, before the starts of the massive rally which culminated in the historic bubble. For comparison, Alan Greenspan made his famous "irrational exuberance" speech in 1996, when the ratio was at 110%. Stocks are not cheap currently, by any means.
  • Real estate valuations are in uncharted territory - all time highs, at least on a annual basis.
  • The sum of the two asset classes as a percent of GDP is also at an all time high of 380%. In other words, after stocks plunged in 2001-02, it was the turn of the real estate bubble to come in and save the day for the asset economy, and thus keep the party going.


  • The "party" kept on going because not only was the credit punch bowl not taken away, but it was brimming with debt hootch: Total debt to GDP rose to the highest level ever.


  • We see that debt/GDP went through four cycles of expanding faster/slower growth (blue line). The "debt junkie" economy apparently needed bigger and faster "hits" of debt to keep functioning. I have marked the chart below with the four cycles and a trendline.


  • It seems that in the past 2 years we may - just may - have finally broken the pattern of constantly expanding debt acceleration cycles. It does not mean that there is less debt, or even less debt vs. the overall economy; but it does mean that its growth is finally slowing down.
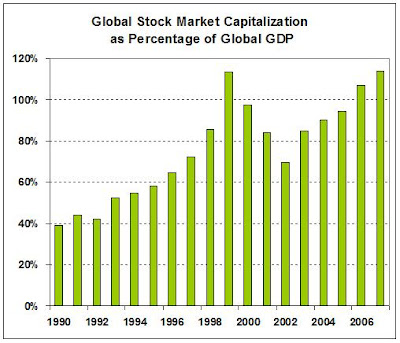
As the process of credit expansion slows down total asset prices will have to ease off. Perhaps we may experience the opposite of 2000-03, i.e. have another stock bubble to balance the collapsing values of real estate. I am sceptical of this possibility because global stock market capitalization is now back to the all time high vs. global GDP. Stocks are far from being undervalued, all over the world.


Data: IMF, World Federation of Exchanges