Sunday, December 31, 2006

Timing The Tea Leaves

John Maynard Keynes famously said:
  • "Markets can stay irrational longer than you can stay solvent" and
  • "In the long run we are all dead"
To wit, timing is everything. The conclusions reached in the previous post were just as valid last year. Mr. Greenspan pronounced his irrational exuberance 4 full years before the tech bubble collapsed: if you had listened to him in 1996 and shorted some hot stock, you got your behind roasted to a crisp before relief arrived.

Likewise, just because household debt is at 131% of disposable income it doesn't mean it can't go to 150% before it collapses back to 65%. We need to look at other indicators to obtain a sense of timing for projections and predictions.

When it comes to servicing debt the most important factor is cash flow, i.e. having enough money to pay the lenders so they don't send out the repo man. We will first look at the overall cash position of US households vs. their liabilities. The chart below shows the amount of cash deposits and money market funds (i.e. liquid cash assets) held by households as a percentage of their debt. The picture is worrying, to say the least...CASH CRUNCH #1.

The next factor we need to examine is how much of that cash goes to service household debt. The debt service ratio (DSR: annual debt payments as a percentage of disposable income) is calculated by the Federal Reserve since 1980. In the chart below I have also included a Derived Repayment Rate (DRR: annual debt payments as a percentage of household debt) and the interest rate of the 10 year Treasury bond.

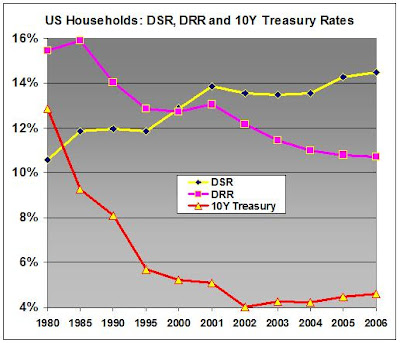
The most important indicator is obviously DSR, or how much income goes every year towards servicing the debt load. Despite much lower interest rates DSR is at all time highs because total debt increased even faster. The Derived Repayment Rate (we could view it as a "gross" interest rate on all household debt) is still dropping since 2002 despite flat to higher long rates. This shows how borrowers switched to cheaper ARM's and other exotic mortgages during 2001-04 (FHLMC and MBA data show this, too).

Short term interest rates are now back to the 2001 levels and as adjustable and exotic loans reset higher, DRR will soon move back to 13%. All other things being equal, this works out to a Debt Service Ratio of 18% over the next couple of years: Almost 1/5 of ALL income of ALL households in the US may thus go towards debt service .... CASH CRUNCH #2.

Another way to look at debt payments is as a percentage of liquid cash assets. The chart below shows how annual debt payments have progressed over the years as a percentage of deposits and money market funds held by households. Right now debt service requires 22% of all liquid cash assets, up from less than 15% in 1980.

Assuming a DRR of 13% as rates reset higher, we may soon see debt service taking up 26.5% of all cash balances... CASH CRUNCH #3.

Another worrisome factor is that 1% of Americans own 38% of all assets and 2% own 55%, i.e. the richest 3 million people own $8.2 million of assets each, the next 3 million own $3.7 million, but the other 294 million people on average just $100,000. This huge dichotomy of American society speaks loudly to the destruction of the once mighty middle class and has serious implications for debt repayment. There is simply very little cash left to the "bottom" 98% of the population: the top 2% possess $1.17 million each in liquid cash assets, whereas the rest a measly $9,800 each, on average. Even as debt soared, cash assets for the vast majority of the people are very small... CASH CRUNCH #4.

In Summary:
It is apparent that we are rapidly moving towards a showdown. For the vast majority of the population debt service is taking up more and more of their liquid cash. The Debt Bubble is acting as a sump pump sucking up money from the bottom 98% to gush it onto the top 2% in the form of bond coupons, dividends and capital gains. Ignoring for a moment notions of
morality and social justice, such a system will collapse once the pump has reached the bottom dregs. The awesome growth of sub-prime lending, interest only, negative amortization, reverse mortgages, cash-outs, etc. are flashing red signals that the "pump" is at the bottom and is starting to run dry. There is very little cash left in the 98% well - the system is "about" to seize up.

Did I hear you ask...WHEN? Well, "about" is a supremely useful word when used in projections. It has a lovely one-size-fits-all quality that can be pulled, stretched and shrunk to justify, verify or nullify all theories. Who needs time travel when we already have "about"? (Smile).

Therefore, to answer "When?" I shall finish as I started, with another page from the life of Keynes. As you may know, he was an avid speculator in everything from commodities to securities. His style was one of taking large positions and sticking with them through thick and thin until he was proven right or until such time as his underlying suppositions were clearly proven wrong.

So this is my "when":

Current conditions are such that a "crunch" may occur at any time. Until and unless they go away, with even a modicum of sanity re-appearing in American finances, the timing is NOW.

Reading The Tea Leaves

I warn you right away that this post is a bit complicated - arithmetically. I hope it won't bore you if you stick with it...

In the previous post (Bubble Implosion) I presented the possibility of a drop in household assets by $22-25 trillion (in 2006 dollars) when the asset/debt bubble collapses. In today's post I will examine in more detail the various assets held by households to see which assets may decline and by how much.

The chart below details US household assets by type (data from the Federal Reserve).

"RE" stands for Real Estate, "Pensions" refers to assets held by private and public pension funds (Social Security not included), "Stocks and MF" are stocks and Mutual Funds held directly by households and "Business Equity" is the equity value of non-incorporated small businesses; the rest are self-explanatory. Note that pension assets are almost 80% invested in stocks, bringing the total direct and indirect household ownership of stocks to $19 trillion.

The total equity and real estate assets of households come to $47 trillion. It will be there that the $22-25 trillion decline will occur. In gross terms, the combined value of real estate, stocks and small businesses will have to decline by some 45-53% to wash out the excess that has been built up over the past 20 years. We need to refine this further:
  1. It is unlikely that house prices will drop by 50% - people need a roof over their heads. They will preferentially liquidate financial assets to service mortgages before they give up their homes. Let's pick 35% as the percentage drop for real estate, or $7 trillion.
  2. Small businesspeople will also try to hang on to their shops, etc. as a way to make a living; let's also pick 35% as the drop for small business value, or $2.5 trillion.
  3. So far we have accounted for $7+2.5 = $9.5 trillion out of a total $22-25 trillion drop expected. This means that $12.5-15.5 trillion will be wiped out from stocks. Let's pick the lower value, just to be on the "conservative" side.
US household stock assets include holdings in foreign stocks - approximately 20% of total. Therefore, out of the $12.5 trillion decline the domestic portion is $10 trillion. Since the total market capitalization of US equities is currently $17 trillion, this implies an ultimate drop of 59% from current levels for US stocks.

This implies a projection for the various popular stock indexes...The levels below are in 2006 equivalent dollars and won't/can't happen immediately. It will be a long decline lasting several years as assets lose value in step with debt liquidation. If I had to guess, the whole process will take at least five years and more likely ten. Note that this is not a prediction based on technicals, super-cycles, Elliot waves, Gann angles and such arcana. It is a top-down fundamental macroeconomic projection based on restoring US asset/debt ratios to more sustainable levels and will be affected by the ultimate asset/debt ratio and the relative performance of other asset classes (i.e. real estate, bonds, etc). Still, the levels below are useful as signposts...

THE BOTTOM LINE


DJIA: ~5,100-6,100
S&P 500: ~580-700

A warning (needless, I hope): Macro-economics is known as the dismal science; it is equal parts science and the equivalent of goat-bone reading. Not only are data grossly and routinely massaged to fit given perceptions of reality (eg seasonality, hedonic pricing, etc), but proper interpretation is always a challenge. Example: the inventory to sales ratio has been dropping for years. Does that mean that businesses are depleting stock and will shortly increase orders? Or does it mean that just-in-time transportation systems and technology have permanently altered logistics? So...be wary of Oracles.

In the next post I will attempt to create a projected time perspective for the above Bubble Implosion process. In the meantime, have a:

HAPPY AND HEALTHY NEW YEAR

Saturday, December 30, 2006

Bubble Implosion
Household debt represents 131% of disposable income, up from 95% in 2000 and just 65% in 1990 (see chart below). The debt has been taken on to maintain a reasonable standard of living in the face of slow income growth versus zooming costs for healthcare, education and energy. The debt burden has become so onerous that it has to go away - somehow. But how?

Two things will happen simultaneously, in my opinion:
  • A significant cutback in consumer spending.
  • A destruction of debt through foreclosures and bankruptcies.
American consumers are already spending more than they make (negative personal savings rate) and cannot sustain more shopping without additional income. The effects of a cutback will be felt from mega-emporiums in Topeka, to truckers and container ship companies all the way to China - which is now home to the greatest manufacturing overcapacity bubble in history. The Chinese have built factories expecting torrid export growth for the next 5-10 years. Manufacturers there operate on razor thin margins and are dependent on high volume for profit. When growth turns to stagnation there will be massive factory layoffs and shutdowns. A vast swath of the nascent middle class will disappear faster than a will o' the wisp. Can China switch to selling its wares to the domestic market? Perhaps for a portion of the manufacturers this is possible but the rest will simply disappear and the country overall will stagnate for at least a decade or more while American consumers attempt to rebuild savings. But enough about China...

The American Debt/Asset Bubble has been blown so large and for so long that its deflation is a given if only because current incomes cannot sustain higher home prices and more debt. The pervasive creation of no money down, interest only, negative amortization etc. exotic loans to "sub-prime" borrowers was just the last hurrah, the last landing at the top of the debt ladder. The process is now working in reverse with defaults rising fast, taking home prices down and cutting demand as even credit worthy potential buyers pull in their horns. This self-reinforcing downward spiral will only stop when all the bad debt has been washed away. The effects will be felt everywhere; from mortgage brokers, to banks and servicing companies, all the way back to the malls of Topeka where it will link and amplify the reduction in consumer spending.

The two processes will merge into one mega-cycle of debt-liquidation and lower consumption until household finances are repaired. There will be a long, rolling recession that may be somewhat ameliorated by the Fed lowering short interest rates, but that will not suffice to convince lenders to loan to already overextended borrowers. Money supply will contract, the dollar may strengthen vs. other currencies and commodity prices will drop - precious metals included. This is the classic deflationary cycle - one that many people are unfortunately not familiar with, believing instead that debt liquidation will result in massive inflation.

A past comment by Mr. Bernanke about "cash helicopters" (before he was Fed Chairman) has been grossly misunderstood by some to mean that the Fed will create hyper-inflation in order to destroy debt. In fact, Mr. Bernanke was describing a hypothetical last-ditch attempt to get an already moribund deflationary economy back into its feet by brute-forcing money supply growth - not what should occur in the initial stages of a slowdown.

To summarize

The Debt Bubble is the natural driving force and a by-product of the stock and real estate asset bubbles created in lieu of income growth since solid, well-paying jobs disappeared for the middle class. All three bubbles will deflate in tandem, probably back to the debt-to-income percentage levels of the early 1990's. In today's dollars this means a wipeout of at least $6 trillion in household debt. How about assets, then?

The current assets/liabilities ratio for households is 5/1; if this were to stay the same, the implication of a $6 trillion debt liquidation is for assets to plunge by $32 trillion. This is unlikely to happen; rather we will see the assets/liabilities ratio move back to the 1990's level of 6.5-7/1, implying a drop of asset values of $22-25 trillion, always in today's dollars.

What will this mean in terms of real estate and equity values? I will deal with that in tomorrow's post - sort of a New Year's prediction...

Friday, December 29, 2006

Houses of Cards

The great Debt Bubble was begat by the Real Estate Bubble. Below is a chart of how overvalued US single family homes really are. It compares new single family house prices to the Consumer Price Index since 1965. Notice the sharp divergence after 1995; it got even worse after 2000.

Since 1965 CPI inflation has gone up 5x, house prices are up 12x. Care to guess how much more home mortgage debt there is since then? Drumroll......46x. In 2000 that figure was "just" 23x.

Sudden debt, indeed...

Thursday, December 28, 2006

Was It Real or Was It Debt?

After the dotcom crash and 9/11 brought the US economy down in 2000, the recovery has been fuelled by debt. Just debt. Nothing else. Zip. Nada. Zilch. Recovery? What recovery? It was just 300 million Americans going deeply into debt to buy imported goods and overpriced houses. Plus to fund the war, of course. And it is a lot worse than you could possibly imagine. Because...

At the end of 2000 GDP stood at $9.95 trillion and it is now $13.32 trillion. But total debt has gone from $26.2 trillion to $41.9 trillion. Go ahead, do the math: for every additional $1 of economic activity the good citizens of Never Never Land borrowed an extra $4.66. It is not just irresponsible, it is bad economics.

Where has all this money gone? We are talking about $15.7 trillion dollars of additional debt here, not some accounting footnote sum. This is simply enormous "money" that has been created and cannot be "hidden". And since it was not "consumed" as GDP in the US it had to go somewhere.

WHERE?

Take a look around you and you will have your answer. If you don't see more factories, schools, roads, hospitals, etc. where you live, it's because you live in the wrong neighborhood. Or, more accurately, in the wrong country. Now visit Shanghai, Dubai and Moscow...

Not to put too fine a point on it, while Americans have been buying more plasma screens and woolly socks plus running a war on credit, the "other" guys have been building their infrastructure with all those trillion that Americans borrowed and spent abroad. Not a good bargain.

It is all borrow, borrow - consume, consume. That way lies bankruptcy, not growth. There has been NO economic recovery, just economic entrapment.

Wednesday, December 27, 2006

What We Should Do

To those that have been following the travails of "Zebediah", the goals are pretty clear:
  1. Increase the personal savings rate
  2. Lower total debt as a percentage of GDP
  3. Re-create a vibrant middle class
  4. Replace fossil fuels as primary energy sources and become energy independ
I strongly believe that all of the above can be combined into a single, comprehensive package: the installation of a new domestic energy regime will create millions of new well-paid jobs, will allow for much lower defence spending and provide the means to consume out of income instead of debt.

Specifically, we should:
  • Sharply raise fossil fuel taxes
  • Raise corporate and personal income taxes - particularly for the top 10% of earners
  • Invest at least 5% of annual GDP into a new energy regime
  • Impose a national sales tax
  • Eventually reduce defence spending by 50%
  • Replace consumption with capital spending as a driver of GDP growth

Saturday, December 23, 2006

The Energy Manifesto or,
Zeb Borrows from the Past (cont.)


...January 21, 1848. Karl Marx and Friedrich Engels publish The Communist Manifesto. Little did they know (or cared) that some 160 years later one Zebediah would hijack their work to further his cause of recouping his sardine loss...

The Energy Manifesto

"A spectre is haunting the World -the spectre of Oil Depletion. All the powers of old energy regimes have entered into an unholy alliance to exorcise this spectre: President and Czar, Saud and Blair, CERA and IEA.

Where is the scientist in opposition that has not been decried as Depletionist by his opponents in power? Where is the opposition that has not hurled back the branding reproach of Peakism, against the more advanced opposition parties, as well as against its reactionary adversaries?

Two things result from this fact:

I. Peak Oil and Global Warming movements are already acknowledged by all Establishment powers to be themselves powers.

II. It is high time that Peak Oil should openly, in the face of the whole world, publish their views, their aims, their tendencies, and meet this nursery tale of the spectre of Oil Depletion with a manifesto of the movement itself.

To this end, Depletionists of various nationalities have assembled in The Net and sketched the following manifesto:

Energy Producers and Users

The history of all hitherto existing society is the history of energy struggles.

Producer and user have stood in constant opposition to one another, carried on an uninterrupted, now hidden, now open fight, a fight that each time ended, either in a revolutionary reconstitution of energy production, or in the common ruin of the contending classes.

In the earlier epochs of history, we find almost everywhere a complicated arrangement of energy production into various orders, a manifold gradation of EROEI rank. In ancient Rome and in the Middle Ages and up to the Modern Era we have wind, water, wood and charcoal.

The modern Fossil Fuel society that has sprouted from the ruins of limited energy resources has not done away with energy antagonisms. It has but established new fuels, new conditions of utilization, new forms of struggle in place of the old ones.

Our epoch, the epoch of Petroleum, possesses, however, this distinct feature: it has simplified energy antagonisms. Society as a whole is more and more splitting up into two great hostile camps, into two great classes directly facing each other -- Oilmen and all the rest....."

...Zebediah was stunned. He could take the Manifesto and with minimal alterations in the text use it as a rallying cry for a New Energy Regime...Plus ca change, plus c'est la meme chose.

People need to wake up from their oil-induced torpor. Society must realize that the future shall not be as the past. Blithely sleep-driving down the six lane Oil Highway leads not to a shopping heaven of well-stocked malls, but off the energy depletion cliff. Combined with an enormous debt load, America is in deep trouble already and the more she delays in implementing a sweeping program of socio-economic change the more she will fall behind and ultimately fail.

But there is absolutely no reason for this to happen. It is not Destiny or Fate that drives the future but vision, planning, competence and the determined application of proper policy. America has enormous dormant powers of patriotism and community spirit that must rise above the meanness of self-aggrandisement and personal isolationism. We must recapture the vision of America as one nation indivisible, not as an agglomeration of 300 million independent contractors. We must strive for our own and common wealth, not just the wealth of the top five percent.

We can no longer each of us hide, cocooned within a baby blanket of plasma screen virtual reality. We must arise to accept and assume responsibility for our own future, shape our desires according to our needs and not by what is available at a discount in the nearby mart. We must all realize that wealth does not arrive in speculation, but is created by perspiration. The invisible hand of the market must also drive a plow, strike a hammer, thread a needle and hold a piece of chalk.

There is no such thing as a free lunch and anyone who says otherwise is just eating yours. Capitalism is the proper application of scarce resources to where the benefit is maximized for all - not just the very, very few. We must thus all and each of us decide where our financial, social and knowledge capital is best properly directed: towards yet more worthless consumables or for the creation of a New Paradigm?

My sardine story ends here - as do all such stories, with a moral lesson. If you have enjoyed it or even gleaned something of value, I am well satisfied and thank you. If I have tired or bored you, the fault is but my own. I will revert - as Mae West used to say - between the holidays (or shortly thereafter) with some concrete policy proposals. In the meantime...

I wish you all a very Merry Christmas and a Happy Holiday Season

Friday, December 22, 2006

Towards a New Economic Paradigm or,
Zeb Sees The Light (cont.)


...Burned by his foolish misallocation of borrowed money in a quest of capital gains, Zebediah realizes he needs income - money that comes from
making things as opposed to participating in the zero sum game of inflating and trading sardine cans...

The very first thing the US needs to do is to reduce consumption and increase saving in order to bring the personal savings ratio back to a respectable percentage of income. Domestic capital is the only way to create a solid, stable financial base from which to fund long-term fixed investment (as opposed to just portfolio investment). A natural corollary is a shift away from the current over-dependence on consumer spending (70% of GDP) towards more capital spending and investment.

But invest in what? Is there an industry that can create millions of new well-paid jobs to overcome the layoffs that will occur at the retailing and financial sectors? Yes, there is. What is more, this is an industry that we must invest in: non-fossil fuel energy.

I don't think I need to expand much on why this must happen, starting right away - just these few simple points:
  • If we don't, we will be paying foreign suppliers more and more money as our own oil runs out. Lose a lot, all the time. Until we run out of time.
  • If we don't, we will spend trillions on resource wars (Iraq...); and in the end the oil will run out anyway and we will be left with nothing. Lifeblood and money for a dry hole.
  • If we don't, the environment will eventually collapse from the greenhouse gases. Remember the dinosaurs.
Energy is life itself - it is not just another commodity and it is foolish to think that "free markets" will take care of energy availability just by themselves. Finance is notoriously short-sighted and prone to manipulation; signals from markets alone cannot be used for formulating policy - not for a world power like the US, anyway.

In the case of energy, policy must precede markets.

The US must first design and build a new energy regime and then apply free-market principles to its smooth operation. We must do so now before our massive Oil Era energy subsidy runs out, while we can still use available oil and gas to build solar panels, wind turbines, ocean thermal energy machines, hydrogen electrolysis plants, nuclear plants, whatever it takes.

This is a huge undertaking: it will give birth to a whole new complex of economic, social and geopolitical relationships. There will be enormous winners and losers, financially and politically. For example, the massive size of the US military-industrial complex created after WWII is necessary for one reason only: the securing of international sources and supply routes of oil. If the new energy regime is both domestic and decentralized (e.g. each house or community has its own solar panel arrays) the need for such a huge military vanishes. Lockheed will not be pleased.

Along with the losers, there will be winners creating millions of highly skilled jobs in design, manufacturing, installation and upkeep of new energy products and processes. New cars, buses, trains, even airplanes - all will need to be re-designed and re-engineered. Novel technology will be born, creating more new wealth based in satisfying real consumer needs, not marginal hedonistic ones.

But all this requires massive capital investment - trillions and trillions of dollars applied on a global scale over several decades. Just imagine how much money is already invested in the Oil Economy. A new energy regime will require several times more, if only because the capture and transformation of diffuse energy sources like solar and wind requires a larger infrastructure. The Second Law of Thermodynamics is immutable.

I had the opportunity to attend a lecture by Jeremy Rifkin (of hydrogen economy fame) some time ago and I asked him how much his vision would cost. "A lot" is all he would say, and that surprised me at first - until I realized that he was not being evasive or coy. There is simply no way to cost-out such an enormous undertaking in money terms; it is too complex and interrelated with every other facet of human life. Perhaps a better way to respond to this question is this: what is the price of life?

If the United States wishes to regain the economic and moral leadership of the world it must strive to create a New Economic Paradigm based on the creation of a sustainable energy regime. To do so it must first renounce the phoney economy of asset inflation and pointless consumerism. It must train, employ and adequately compensate real scientists and engineers instead of glorifying hedge fund managers and financial derivatives engineers.

...Zebediah is finally hopeful because he sees a way forward. But can he convince his alphabet friends? What must he do? What can he do? For that segment, as always,...

Stay Tuned!

Thursday, December 21, 2006

Zeb Faces Reality or,
Put the Damn Sardine Can Down and Go to Work, Zeb (cont.)

...Zebediah cannot run for the hills and can't claim disability insurance. It slowly dawns on him that HE ALONE is responsible for getting out of the mess - Yorick, Xavier and all the rest of the alphabet friends just shrug and mumble "caveat emptor Zeb, it's the free enterprise system". So Zeb is going to have to noodle a way of solving the problem on his own...

Let's state the problem again:
  1. Very high debt/GDP
  2. Overpriced assets
  3. An economy that mainly consumes imported non-durables financed by the combination of (1) and (2). Personal consumption now makes up almost 70% of GDP.
The importance of this merry-go-round to the "normal" functioning of the economy was made starkly evident just yesterday, when President Bush in his news conference said, and I quote:

"I encourage you all to go shopping more".

Now, I readily admit that I am an idealist; I prefer that Presidents say things like this, instead:

"The credit belongs to the man in the arena whose face is marred by dust and sweat and blood, who strives valiantly, who errs, and who comes up short again and again, who knows the great enthusiasms, the great devotions, and spends himself in worthy causes."
Teddy Roosevelt

I know the world has changed a great deal since T.R.'s time, but..."go shopping more"? Is that what this great nation has been reduced to? Trips to the mall encouraged by the President? Why? Are we in the depths of Depression and Mr. Bush needs to stir the people with a modern day version of "The only thing we have to fear is fear itself"? Not hardly. But "go shopping" was not an off-the cuff remark, either: it seems that holiday shopping is not going very well this year. Draw your own conclusions.

I strongly believe we have reached the outer limits of the phoney economy. The personal savings ratio has turned negative (see chart below) and as we consume more than we make we have to liquidate assets from savings - financial or other. Borrowing more does not help because interest payments must come out of income or accumulated savings. Selling assets is the only way out, for as long as consumption goes on unchecked.

In addition, debt service now takes up a record high percentage of income (see next chart), even though interest rates are still very low by historical standards.

Who owes the debt is just as important as how much there is (next chart). The largest piece, Financial Sector, is made up mostly of packaged mortgages and Government Sponsored Enterpise (FNMA, FHLMC, SLMA, etc) debt. Social Security debt (the so called Trust Fund) is not included. Households owe almost the same, again mostly as mortgage debt. The whole pie comes to $42 trillion, or 315% of GDP - if Social Security was included it would be 350% of GDP.

...Zeb suddenly realizes that he has got to stop wasting his time with that stupid can and start doing something to get himself out of debt. You see, in order to buy them sardines our foolish fish fan had borrowed the million bucks. He had thought he couldn't lose (best fish...EVER!) - what was a tiny bite, eh?

Deeply regretting his excess, Zebediah now rolls up his sleeves and goes to work. Doing what, you ask? By now you surely know the answer (smile)...

Stay Tuned...

Wednesday, December 20, 2006

What To Do Now? or,
Zebediah's Choice (cont.)

.....Zebediah is in trouble. Not only did he pay a million bucks for ordinary sardines but he has opened the damn can and can't fool anyone else into paying more than a buck fifty for it. What now?

The US has pumped up asset prices through debt so much that diminishing returns have set in and a correction is imminent: you can't have return on assets at the lowest level ever and debt at the highest and still pretend there is no trouble. But what kind of trouble? Weimar Republic cash by the barrow-full trouble, or Great Depression trouble? Or, maybe, neither?

The debate rages between the usual "market participants" masked by polite, erudite and academic terminology, though the occasional "helicopter cash" comment escapes to underscore the true underlying fears. Naturally, comments are significantly less guarded in the blogosphere - to put it mildly. They range from extreme superinflationary gold-buggery and bi-metalism, to down and out survivalist wood stove comparisons and advice about stockpiling, ah, feminine hygiene products. Right. Moving along to (I hope) saner commentary...

Devoted "inflationists" claim that the US will have no choice but to devalue the dollar and inflate its way out of the onerous debt. In my opinion that is nearly impossible because of the following reasons:
  1. The only kind of debt that can be "destroyed" this way is fixed-rate, long-term bonds or 30 year mortgages. There is much less of such debt now than, say, 1980 and what there is, is constantly securitized and swapped to and fro into short and variable through the enormous derivatives market.
  2. Monetary inflation immediately results in very high interest rates, making debt payments extremely expensive and rendering debt roll-over almost impossible. Defaults would rise dramatically and a massive recession would ensue.
  3. The only way to "inflate" in this fashion is by printing money, relegating the dollar to the same league as the Weimar Republic mark, the Argentinian peso of the 1980's, etc. It is ludicrous to imagine that any sane administration would choose to do that by choice and throw away the global reserve status of the US dollar.
  4. American assets would become dirt cheap for foreigners with strong currencies who would proceed to strip the country bare - like wealthy Americans did to Europe after WW I.
  5. How would the US economy function under such a scenario? By monetizing gold and silver? Keep in mind there is a finite amount of such metals in the world - that by itself creates ideal deflationary conditions. Barter? Please...
In the sardine story, the extreme inflation scenario is equivalent to Zebediah cutting off his fingers on the ragged, sharp edge of the can, proclaiming himself incapable of working to recoup the million bucks and asking for disability insurance, too. Fat chance.

The "Save and Re-Use Your Tampax" scenario is even more extreme because:
  1. We are not going to run out of resources suddenly.
  2. There is a lot of "fat" in the system - no one needs to have yet another WalMart open next door to the 21-screen magaplex. Do with less - yes, do without - no.
Again, this would be like Zebediah wolfing down the very last sardine and saving the can for future use as he heads to live in the woods - pup tent, firewood, Winchester rifle, wolves... heroic stuff. Slim chance.

If you are by now biting down your fingernails with anticipation and excitement (yeah, right!) to find out what will happen....

Stay tuned!


Tuesday, December 19, 2006

Diminishing Returns or,
Eating The Sardines (cont.)


So far we have seen that in the US:
  1. Total debt/GDP is extremely high (330%).
  2. Debt/GDP is rising at an unsustainable rate (25% per year).
  3. The economy has a debt "dependency" - it is hooked on debt to keep asset prices rising.
Today I examine if this asset bubble economy is economically sensible and viable.
I look at three standard financial ratios:

a) Leverage or gearing, i.e. the ratio of total debt to the value of assets
b) Return on assets (ROA), i.e. the ratio of annual profit to the value of assets
c) Return on equity (ROE), i.e. the ratio of annual profit to net worth (assets minus liabilities)

In the case of a nation the closest equivalent to "profit" is GDP; however imperfect it may be in measuring true economic conditions, it is suitable for comparison purposes. It is also important to note that although these ratios are widely used in evaluating the financial health and performance of businesses, their absolute numbers are not directly comparable. For example, a leverage of 30% may be perfectly fine for a corporation but onerous for a nation.

With that in mind, the first chart below shows the ratios of:

a) Total debt to the combined assets of all US households and businesses (i.e. leverage) and
b) GDP to combined assets (ROA).

(All data come from the Federal Reserve "Flow of Funds Accounts of the US ")

Notice how leverage has increased while ROA has declined - debt has increased and the price of assets has gone up, but the economic "profitability" of assets has declined. This is very significant: the economic return we get out of assets is going down even as we borrow to create more of them or, more likely, as we inflate their value and borrow against them.

Another measure we need to look at is the marginal return on assets, i.e. the change in GDP divided by the change in assets (Δ GDP / Δ Assets) or how much more GDP we get for an additional increase in the value of assets. Not surprisingly, this has been coming down as well.


The one remaining financial ratio is Return on Equity, in this case GDP divided by Net Worth, charted below. (Keep in mind not to directly compare apples and oranges, in this case the 40% national ratio to a corporate ROE which is typically 10-15%. )

What is useful to observe here is that this "national ROE" ratio has been stuck at the same level despite the rapidly expanding application of debt capital. This is a very strong indication that debt has been taken on to finance purchase of consumer items and passive assets (eg real estate and portfolio investments), instead of adding to productive capacity in the form of plant and equipment.

From the foregoing (plus previous posts) it becomes plain that the US has created a debt/asset bubble that is failing to produce proportionately higher tangible economic benefits, as measured by standard financial analysis ratios. This means that we are experiencing diminishing returns.

In "sardine" terms, the can has been opened, the fish has been tasted and found to be plain ordinary sardines - despite the exorbitant price paid.

So what is Zebediah to do? Can he get his money back?

Stay tuned.


Monday, December 18, 2006

The Debt Intensity of Economic Growth or,

The Sardine Can

The previous post (see below) showed the un-sustainability of current trends in new debt creation in the US economy. But how important is debt creation to GDP growth – how much additional debt does it currently take to produce one additional dollar of GDP? Let’s call that ratio “Debt Intensity of GDP Growth”. The chart below shows this ratio since 1965.

It immediately becomes apparent that the US economy has lately become a desperate debt junkie, needing increasingly massive hits of borrowed dollars to create economic growth. As the economy transformed from “production-based” to “asset-based” it had to find additional capital to sustain higher asset prices so as to create consumption through the wealth effect. Unfortunately, it has been “debt” capital instead of “equity”. Indeed, such a massive amount of “money” (total US debt is currently $44 trillion) is simply not available in "equity" form, since it is equivalent to 330% of US GDP or 140% of the world’s combined GDP, ex-the US.

Such capital, therefore, has been created as “money” via the ever expanding synergy between lending and asset appreciation, i.e. a debt bubble. At some point, however, “someone” may want out of the game and wish to liquidate his asset(s). If there is no lender immediately available to provide incremental credit then the seller must find a buyer with “equity” and/or accept a lower price. That is how debt bubbles burst, historically.

There is a story that illustrates this point (NB - thanks to Sandra):

Andy convinces Billy to buy a can of sardines at a high price by telling him how wonderful they taste. Billy, being greedy, decides to resell them to Charlie for a profit at an even higher price by convincing him too about how great those sardines are. The process gets repeated several times until the last buyer, let’s call him Zebediah, pays a million bucks to Yorick for a can of the “world’s absolute best sardines – EVER”. Well, Zebediah decides to open the can and eat the sardines, only to discover they are ordinary, plain sardines. Furious at being swindled, he yells at Yorick:

“You crook! You liar! I paid you a million bucks for just plain ordinary sardines. They were not the greatest tasting sardines - EVER”, yells Zeb.

Yorick shrugs and replies…

“Hey Zebediah, you are such a schmuck. Those were not eating sardines – them were trading sardines!"

Likewise for overinflated assets, if someone decides to "eat them", instead of just "trade" them.

But what consitutes "eating" an asset?

And what does that mean for the economy?

Stay tuned.

Sunday, December 17, 2006

It's the Cash Flow That Does You In
Ask anyone: the repo man only comes calling when you stop making payments. His boss doesn't care where the money comes from, so long as the check is in the mail. Maybe you took out a cash advance from yet another credit card, or some sub-prime lender agreed to give you a third mortgage. Could be, you got to meet Guido. Provenance of cash doesn't matter to the lender. Cash flow matters.

Cash flow matters to the US, too. The chart below is net new debt assumed every year, as a percentage of GDP. For every dollar produced, the US now borrows 25 cents. If this goes on any longer debt will swamp the economy and edge out everything else. You will notice it is rising exceedingly fast, partly because compounding is savaging free cash flow. Since total debt is already at 326% of GDP and since government and households are running deficits, financing interest payments by more debt is already accounting for most new debt.


How long can this last? Not very long at all. Projecting out current conditions (25% debt growth, 6% nominal GDP growth and an average interest rate of 5%) we produce the following pretty absurd chart.


Within just 10 years debt would be 14 times GDP and interest alone would take 72% of GDP!
Reductio ad absurdum. It cannot happen and will not happen.


So what
will happen? Stay tuned.

Friday, December 15, 2006

It's 9:00 PM - Do You Know Where Your Mortgage Is?

Bought a house in the past 10 years? Probably. Took out a mortgage? Of course you did.
The first chart below is the annual increase in residential mortgages, i.e. the change in mortgage debt outstanding between consecutive years. Lots, eh? But that's not the point. Keep reading.


Mortgage lending was once boring business. George Bailey stuff. Not anymore. Now it is ARM, MBS, CMO, CDO, HBX stuff. Your mortgage has been sold, packaged, securitized, insured, indexed, loaned, hypothecated and traded back and forth a million times.

The presumed value of your monthly payments is likely serving as collateral for a Bermuda-based hedge fund's bet on pork bellies. Or it has been used to pyramid the issuance of credit default swaps for extending even more mortgages.

Of those new loans above, 50% are now packaged by private entities. See the next chart. The connection between the housing bubble and "funny money" debt is pretty obvious. Won't you say?


So? What's it to me if my mortgage is a juvenile delinquent night-crawling for an easy yield pickup? As long as you pay up regular as a swiss clock - nothing. But if you need to catch a break, you need to know that George Bailey no longer runs the show down at Building & Loan. A black box does. And it doesn't make collections to help you out.


Saturday, December 9, 2006

Can You Afford Your Mortgage?

Back in 1970 your mortgage was small and your salary covered it nicely and left change for the latest T-bird. Now it's a stretch. It is simply amazing how deep you went into debt since 2000.

Amazing.


Thursday, December 7, 2006

Americans In Debt

America is a rich and powerful country, inhabited by rich and powerful people. This is a chart of real GDP per person. Nice growth...But do not be hasty.


Americans are also in debt. Lots of debt. This chart just adds on top of real GDP the total real US debt per person. Looks different now, doesn't it? Still think Americans are rich and powerful?

Saturday, December 2, 2006

A Wall of Woe

There is a brick wall of debt and we are approaching fast. And we will hit. No doubt about it.


Aha, you say.. This is nominal debt, meaningless... Right you are. So here is real debt, in constant 2000 dollars.


But you are not concerned yet because America has a big economy. Naturally you want to see debt as a percentage of GDP . Here it is, then.


Now,this picture is not very comforting at all. It is actually more troublesome than the others because it makes plain how steady debt/GDP was for decades up until 1980, when it just took off. Sudden Debt.

Don't quit reading yet. The debt is in two very broad categories: Debt of the non-financial sector (households, corporations, government) and the financial sector (banks, brokers, GSE's, etc).


Now, that doesn't really look so bad, though if you look closely you will notice that the scale starts at zero, so the move from 142% of GDP in 1980 to 214% in 2005 looks benign. Compared with what happened to financial sector debt, it is.


To make the comparison between financial and non-financial sector debt more visible, the next chart is relative, i.e. 1980=100. At some point we need to get scared. Being a debtor nation is one thing. Being broke is another.