With new variants popping up and various vaccines being administered around the world, the following chart is quite interesting. I won’t comment further, for explanation read the note at the bottom of the chart.

With new variants popping up and various vaccines being administered around the world, the following chart is quite interesting. I won’t comment further, for explanation read the note at the bottom of the chart.
One chart… SP500 in log scale, annotated with four seminal tops and crashes in the last 40 years.
The current run is by far the longest and has an unprecedented climactic extension, as trillion$$ have been pouring in - an unintended (?) effect of pandemic cash.

The recovery from the debt crisis took huge, coordinated cash injections from most all central banks, which continued for years and fueled markets with negative real interest rates. Until the pandemic hit and central banks made the previous cash torrent look like a drip. Predictably, but definitely not necessarily, markets have gone - literally - ballistic.
Valuations of everything, from lumber to junk bonds, have become manic. It remains to be seen how central banks react to the next crash… print even more?
The US stock market is making new highs, but if you look closely it is doing so with diminishing breadth. The number of new highs minus new lows is very weak, meaning that new highs are achieved through fewer and fewer index heavy stocks. For the benchmark S&P 500, yesterday there were only 36 more highs than new lows - chart below.

Interestingly, it looks to me that one of the major “culprits” in shaping (window-dressing?) the capitalization-weighted S&P is Tesla, which is now #8 on the list and accounts for 1.45% of its total performance. In days when top shares like Apple and Amazon are down or flat, in comes Tesla charging with 4-6% gains and, voila, new highs. I’ve been noticing such shenanigans for weeks now.
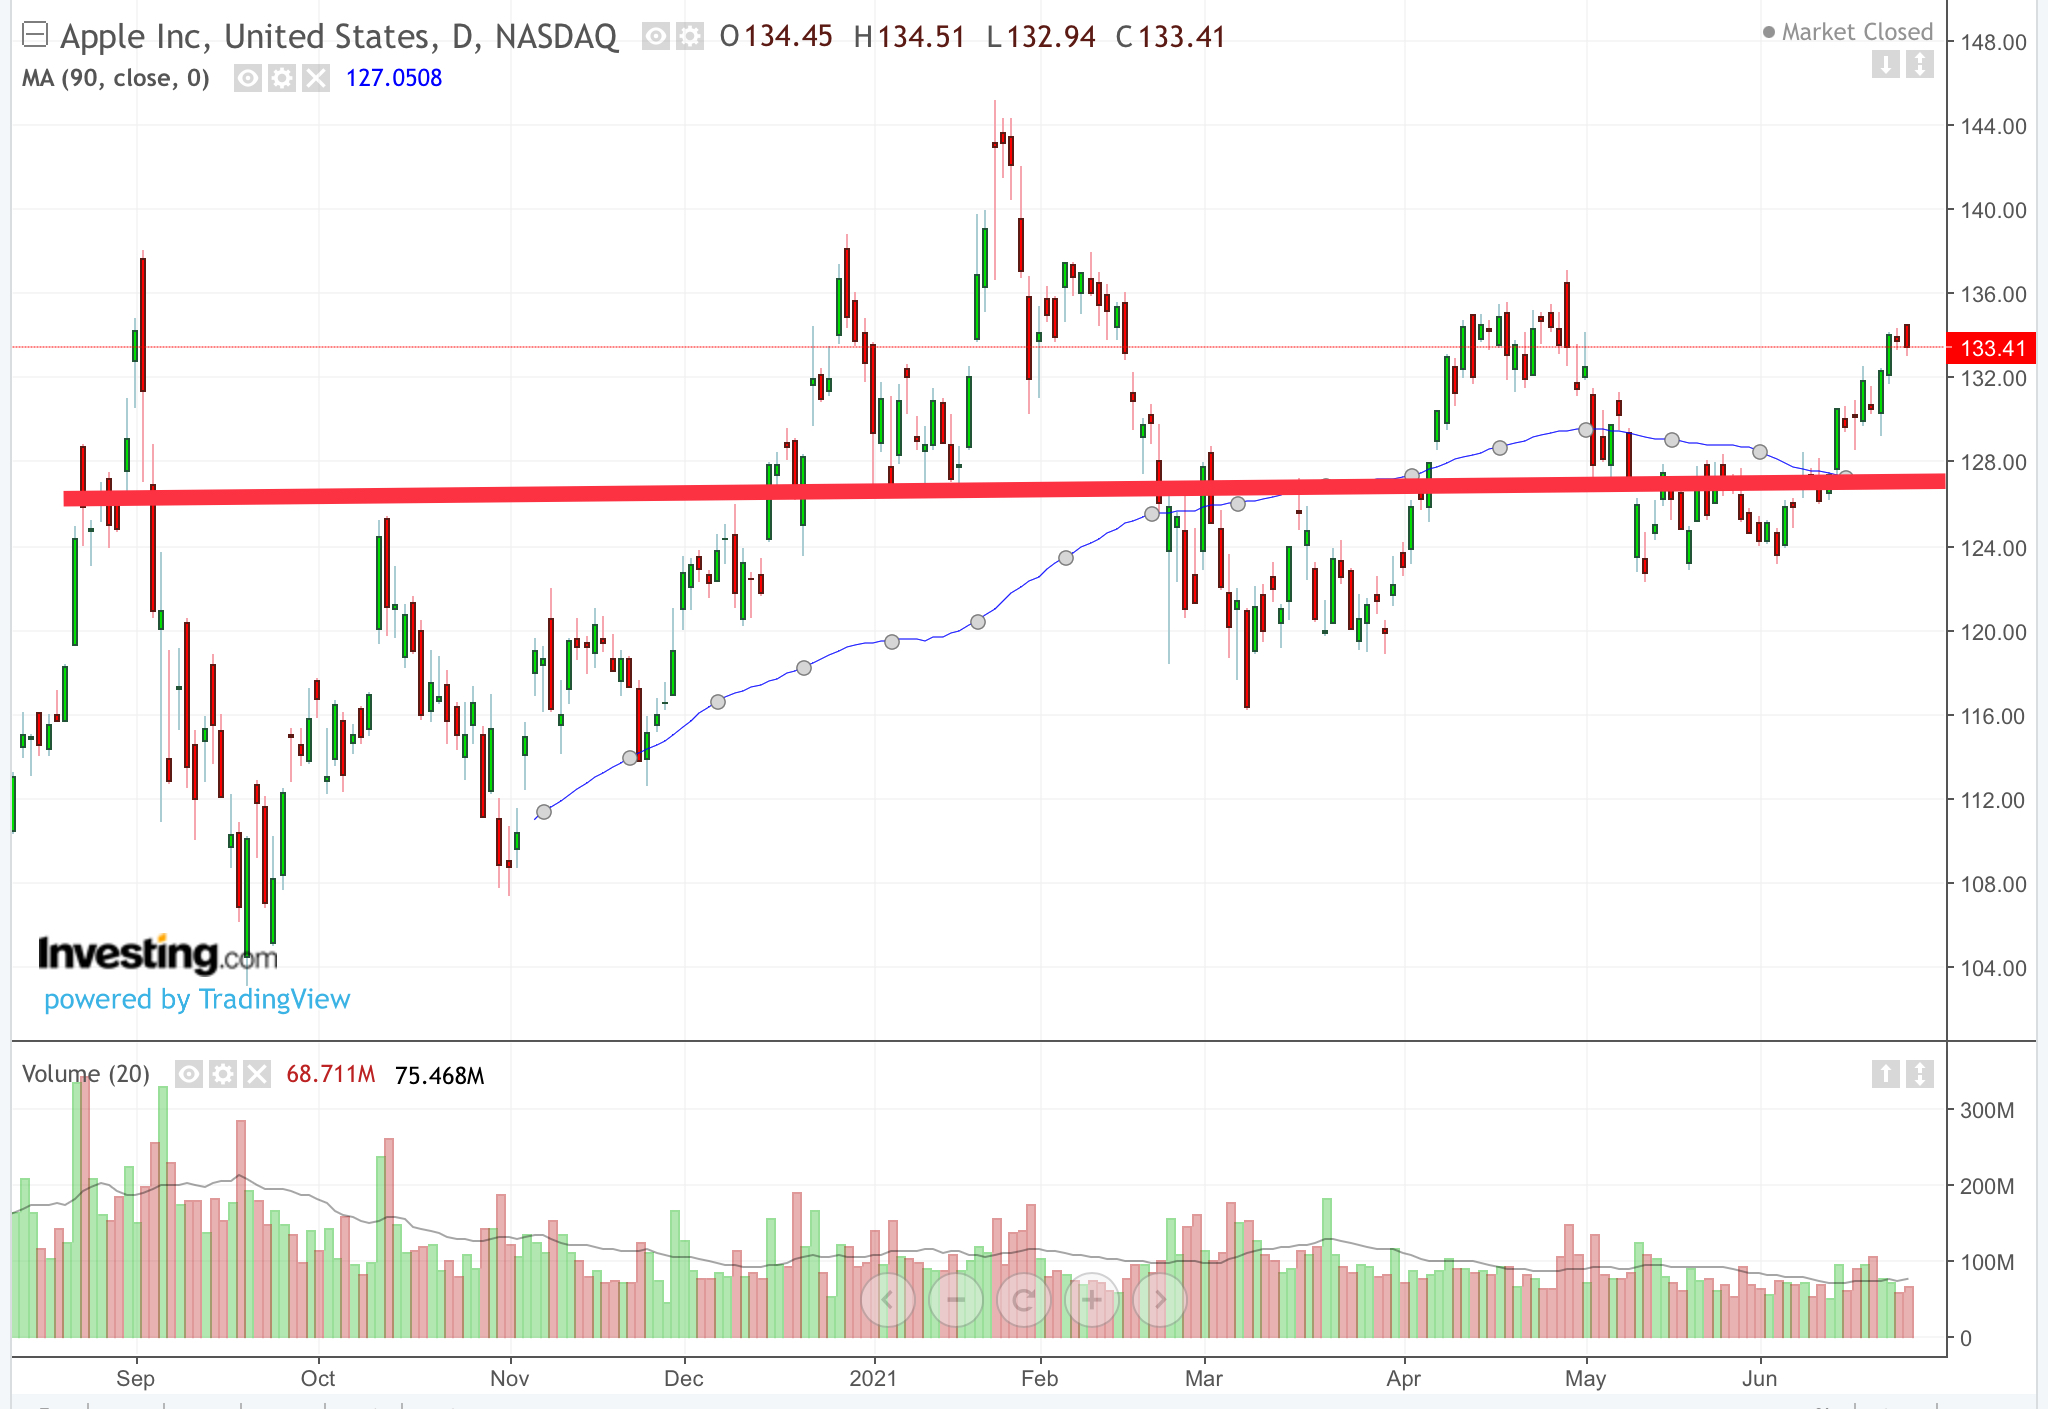
For example, #1 Apple, which accounts for 6% of the index, has been just oscillating around its 90 day moving average for almost a year now.
Same thing is going on in Amazon, #3 on S&P accounting for 4.2% of the index. Going nowhere for 12 months, also just oscillating around its 90 day moving average.

Notice how daily trading volume has also subsided for both.
But Tesla? It is sitting right at its 90 day moving average after a previous massive 350% 12 month rally.

Conclusion? This market is getting very narrow (fewer new highs) and thinning out (lower volume). Both are signs of internal weakness, no matter what the index headline is doing.
PS As of yesterday the top 10 companies in S&P 500 accounted for 28% of the index value. That’s 2% of the companies… talk about a narrow market 😱
Today, a chart comparing the Treasury yield curve changes in just the last 21 days (chart below).

The curve has flattened out, seemingly only a bit, pivoting at exactly the "belly" point of just under 6 years which, by the way, is the average maturity of the entire US federal debt.
However, the linear scale of the Y axis above does not show the real magnitude of the change - so here's the same chart in log scale.

We can immediately grasp the significant rise in short term interest rates in the money market end of the yield curve,i.e. exactly where the "real" economy operates (trade financing, letters of credit, etc), and where financial markets get almost 100% of their day to day funding for their securities' inventory. Those costs just jumped by 5-8 basis points. I know it doesn't seem like a lot but, in fact, it is significant.
Here's an example: a broker/dealer in Treasurys, MBS, or corporates will almost always "carry" his inventory, also known as his "book", by borrowing in the money market, usually overnight (or tom-next to account for settlement dates).
So, the dealer is carrying a book that yields, say, an average 1.0% and until last week it was being financed at 0.01%, for a net profit of 0.99%. As of today, this cost has jumped to at least 0.06%, for a net of 0.94%, i.e. a 0.05% rise in his/her carry cost has resulted in a profit decline of 5.05%. And that's on a gross basis; when you look at the result on a dealer's equity capital return the effect could be much greater, depending on his book's leverage. Given that dealers routinely employ 10x and often 20x leverage, the negative effect on his firm's equity bottom line could be painful.
That's a pretty simplistic example, of course. Dealers employ all sorts of hedging strategies to protect from market risk, to an extend. All of those strategies, however, come at a cost which reduces gross return, so no matter how you slice it a funding cost increase will always lead to lower carry profits, all other things being equal.
Savvy professionals keep a hawk eye on two markets, in that order: (a) the money market (ie interest rates and liquidity for up to maximum 1 year) and (b) the note/bond market.
No matter what Mr. Powell says, therefore, what REALLY matters is what he does, observed and understood not by the hoi polloi, but only by the "worker bees" in the front lines.
This blog was started in order to record the huge amounts of debt being created in the US and many other countries back in the mid to late 2000s. In turn, this debt fueled a massive bubble in real estate and other financial assets which rather quickly resulted in a crash.
The world hasn’t been the same since, as central banks and governments intervened in unprecedented fashion to save banks, investors/speculators and the wider economy. Even some PIGS were “saved”, some more than others (Greece was disgracefully forced to default on its debt and went into a state of prolonged penury which persists to this day).
So, central banks are now anointed Salvator Economia, no longer limited to safeguarding monetary probity. Instead, they have usurped the role of elected politicians, wielding enormous fiscal power via the printing press. Think of this alone: each month the Fed increases debt, mostly federal, by $120 billion. That’s $1.44 trillion of added debt per year - and Congress does not even get to vote on it! Inflation, the stability of the dollar? Congress, ie the voting public, is not consulted in the least. Just a dozen or so unelected bankers decide on what is the largest ever addition to the people’s debt burden in History.
And this is happening all over the world, not just the US (China is more circumspect, very pointedly). Global debt has now spiked to $285 trillion, or 355% of global GDP - chart below. A lot of this burden on the “real” economy has been added in just one year, during 2020 (red line) - and it keeps growing at a record pace in 2021, too. That’s the very definition of Sudden Debt.

Governments and central banks are furiously trying to throw the wool over peoples’ eyes by claiming there is nothing to worry about - just as “analysts” did back in 2006-07. Only this time the burden is even greater and asset valuations even more extreme and delusional in nature (cryptos, meme stocks, NFTs).
All the while, the chorus of serious financiers warning of impending trouble keeps getting bigger (Mr Bury of Big Short fame just warned of “country-sized” losses), but no one with the authority to do something seems to be listening.
To paraphrase Kipling, “lest we forget, Oh debt” (from his poem aptly called Recessional). In this case it may end up as Deeply Depressional, I’m afraid.
PS Wink to AKOC and his poetic references 😄
The Fed is buying $120 billion in Treasurys, MBS etc debt every month, ie it is monetizing (printing) about that much monthly, ballooning its balance sheet by the same amount. The Fed’s reasoning is that the economy is still not healthy enough, yet it is obvious to anyone who can fog a mirror that the main result is a manic bubble in everything from stocks and real estate all the way to NFTs.
Naturally, everyone is trying to guess when the punch bowl will be removed, even partly, aka taper the purchase program. I strongly believe that the Fed should do so right away, and here are two related charts to support my opinion.
In the first chart we see that the Treasury’s account at the Fed (basically, the governments “wallet”) has been emptying fast as the money it “printed” is sent to just about every American - helicopter money. The decline is approx. $900 billion. That money immediately finds its way into the money market as bank deposits and money market fund assets. But, banks and funds can’t find enough actual demand for loans/securities, at least not enough that meets their credit criteria.
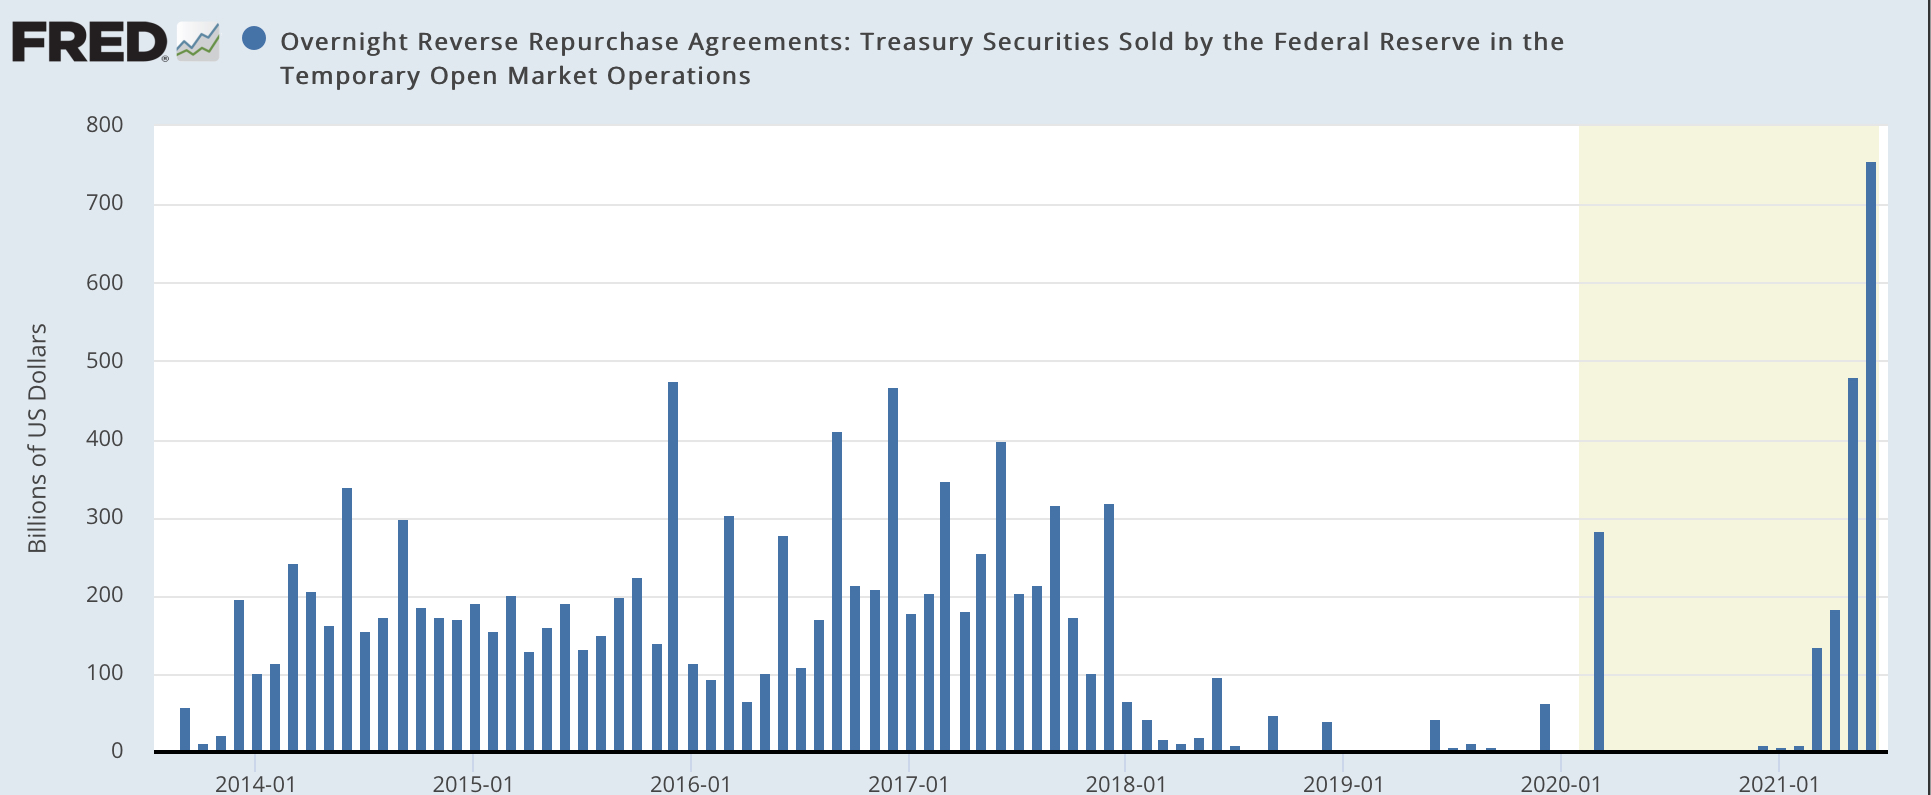
So, what do they do with the flood of money? They give it back to the Fed as an overnight reverse repo at 0.05% (just raised from 0%). This amount just hit yet another record today at $765 billion, second chart.

By accepting all this enormous amount of cash, the Fed is tacitly admitting that its QE is no longer needed since the $765 billion is 6.5 months worth of QE that can’t find any use in the real economy. And there is more cash coming from the Treasury too, as it continues to draw down its account. It's a mess created by the Fed and the Treasury and it needs to be dealt with, right away.
Think of all this cash as a lake of highly combustible fuel. We already see the flames of nearby fires (commodity, transport and asset inflation)... how long before it reaches the lake and sets consumer inflation raging?
My bet/hope is that the Fed is looking at all this money coming right back at it and is wondering… ummmm, do I still need to print so much of the stuff? What’s the use?
Someone is throwing around taper dates and numbers at the Fed, for sure. Soon, too, I hope.
As I wrote in my previous post, short term interest rates rose sharply last week after the Fed signaled the end of ultra low rates. The effect on the 2 year Treasury note was particularly pronounced, its yield nearly doubling from 0.15% to 0.285% intraday and settling a touch over 0.25% on Friday (Chart below).

2 Year Treasury Note Yield
The average maturity of all publicly held US debt (ie excluding Social Security holdings) is currently 5.5 years. Therefore, a rise in the short to medium end of the yield curve is crucially important - and more so now than at any other time in US history, since government debt has soared to 127% of GDP, up from just 105%, in less than 2 years.
While the chart above may raise eyebrows, here's another that must keep Janet Yellen awake at night. It shows the 2, 3, 5 and 10 year yields; pay attention to the two lines at the bottom, the 2 and 3 year yields. They have a long way to go up, to merely equal pre-pandemic levels. For example, the 2 year could rise a massive seven times! The 5 year, closest to the entire debt’s average maturity, could rise 3.5 times. And we’re not even taking into account the possibility that inflation will stay high far longer than a few months.

Such rate increases will cause huge problems for the US’s ability to properly service its debt, see the chart below from Yardeni research. And that’s only for marketable debt, ie excluding the Social Security trust fund. An annual interest bill of nearly $1 trillion is clearly unsustainable for the US - given current tax revenues, that is.

So, put all of the above together, and what should, or could, Mrs. Yellen do? Easy answer, really… raise corporate and personal income tax rates (at least for the ultra rich), impose capital gains taxes at the same rate as earned income, and possibly institute a federal VAT. I don’t really see any other, “easy” way out. Indeed, I believe the recent G7 US initiative to agree on a minimum 15% global corporate tax rate is a first step in that direction.
You read the post title and go…WHAT? WHEN? Seriously?
You may be excused your incredulity since none of the MSM, financial and not, carry this headline.
Nevertheless, it’s 100% true.
Two days ago the Fed raised two key short term rates by 5 basis points (0.05%): the overnight reverse repo went from 0% to 0.05% and the IOER (Interest On Excess Reserves) from 0.10% to 0.15%. That’s interest paid by the Fed to the banks, money market funds and other such participants in the money market who are permitted to deal directly with the Fed.
In essence, the Fed just raised all short term interest rates by 0.05%. It may not seem like much, but with rates near zero, even 5 bp makes a huge difference. For one, it makes carry trades more expensive and thus makes holding very short term Treasurys less attractive.
The reaction was immediate, as 2-year Treasury yields predictably jumped by 5 bp to 0.21% in the secondary market. That’s the highest level in one year(chart below).

And what about the “liquidity drain”? Yesterday, the Fed’s overnight reverse repo (now at 0.05% vs. 0%) soared to a new all time record $755.8 billion. That’s an operation where the Fed sells Treasuries to banks, money funds, etc, with an agreement to repurchase them the next day at a slightly higher price (0.05% annualized). Participants can choose to keep rolling them over, for as long as the Fed elects to do so. Obviously, by accepting ever larger amounts the Fed is actively draining at a record pace.
Record Liquidity Drained Overnight
Is this important? You better believe it, because the Fed’s actions signaled that the ultra low interest rate era is over. I fully expect more such moves in the future. They will likely be cautious and seemingly technical in nature, out of the non-professional public’s eye. But, for professionals in the money market it is exactly such moves that matter.
The other, less obvious conclusion is that banks and other very short term investors, like money market funds, are choosing to do the reverse repo with the Fed in record amounts instead of using it in other, riskier ways.
So, we are seeing a cautionary trifecta for all markets: higher interest rates, record liquidity removed by the Fed and a rise in risk aversion. Commodity markets reacted instantly, significantly marking down prices across the board. The Dow Jones Commodity index saw its biggest drop in over a year (chart below).

Bond yields spiked up after yesterday’s Fed comments. While most everyone looks at long bonds with maturities 10+ years, the real “action” is taking place in the yield curve’s “belly”, the 5 to 7 year maturities.
Given the current shape of the yield curve, right now that’s the most sensitive and important spot to pay attention (chart below) Let’s examine today’s yield curve (blue line).
First off, it’s very steep, meaning bond investors expect interest rates to rise, so they demand more return for the extra duration risk. Rates overall are significantly lower than in 2019, particularly in the “belly” 5-7 years (the very short term is 100% Fed, it doesn’t matter what bond traders do).
Notice how the biggest difference in today’s yields vs 2019 is in precisely that 5 year maturity, almost 100 basis points (1%). Should rates continue to rise, that’s where the biggest potential yield upside resides, and, thus, the biggest market risk.

What does the 5-year bond yield chart look like? In a word, very interesting - see below. If you are a chartist, the current pattern is a flag and pole, ie a continuation pattern that “reads” at least 80 bp (0.80%) higher. That dovetails very well with the yield curve comment above.
Also, on the same chart notice how previous flagpole patterns were good predictors of subsequent moves.

The Federal Reserve was founded by Woodrow Wilson in 1913. In its 106 years as guardian of the US dollar to the end of 2019, the Fed accumulated a total of $2.64 trillion of federal government securities on its balance sheet - Treasury bills, notes and bonds.
But in just the last 18 MONTHS alone, it bought another $3.1 trillion, bringing the total to $5.7 trillion. Think about it...in just a year and a half the Fed monetized ("printed") more government debt than in its entire history of 106 years!! (Chart below)

So, let me get this straight: The Fed, Treasury and (most of) Wall Street thinks this is OK? That it is OK to continue monetizing to the tune of $1.44 trillion per year? (QE is currently at $120 billion per month). To add each year more money, more fiat dollars, more debt than in the previous 100 years??
And that the spike of inflation, already running at 5% over the past 12 months and even higher on a monthly basis, i.e. it is accelerating, and which is obviously caused by this deluge of fresh money, is going to - somehow - be transitory, without taking immediate and drastic remedial action?
What kind of Kool Aide are they drinking?
In the 1970s and 1980s the same brand of officials and "analysts" thought that oil price shocks were "transitory". It took two decades of very high interest rates, recessions and untold economic pain to tame the double digit inflation that became entrenched and proved to be NOT transitory, after all. Does anyone now remember or respect Arthur Burns, the. Fed chairman who in 1970 caved in to Nixon’s demands for easier money so that he could win the elections? Maybe… but I’m sure no one has even heard of George Miller, a Carter era chairman who lasted less than two years. Dustbin of history for the spineless. But everyone remembers Paul Volcker, the chairman who had to come in and very painfully clean up the huge accumulated mess of his predecessors. A giant amongst Fed chairmen, even literally at 6ft7in (2.01m).
Today, we have a money supply shock which is raising prices for everything, not just crude oil. And it is doing so very, very fast. Why? Because sane suppliers of raw materials and services, labor included, realize that the dollars they get in return are worth less in real, physical goods and services terms, than just over a year ago. So, they demand more dollars for them - thus, inflation. Add to the mix China, the biggest global buyer of commodities who is currently buying huge amounts, stocking up against the very real possibility of geopolitical friction and, voila, this isn’t going away soon. Again, unless the Fed, ECB, BOJ and BOE immediately change their tune.
Let me use the Bernanke helicopter paradigm:
You are standing in your soybean field when a helicopter approaches and proceeds to "dust" it with a million dollars. And not only your field, but Farmer Joe's too, right next door, and so on down the line. And the heli keeps on circling and raining money, and not only over fields but on factories, offices and homes, too. The silo operator who buys your crop? He’s dusted. The cattle grower who buys soy to feed his cows? Dusted. The family home where people buy steak? Dusted.
There's an almost unlimited supply of dollars, but they can’t make your soybeans grow any bigger or faster - their supply is, of course, physically limited by land, nature and the application of energy and labor. Limited physical supply meets unlimited money.
At what price, in dollars per bushel, will you now be willing to sell your soybeans to the market?. More, less or the same as before the dollar helicopter? I rest my case.
To justify the continued torrent of fresh cash monthly via QE, the Fed and its happy Wall Street chorus of “economists” keep harping on the lower than expected number of monthly payroll additions. That’s disingenuous, to say the least.
Why? Because the number of job openings, ie jobs that go wanting because employers cannot find people willing to fill them, is now at at an all time record high, and equal to the total number of unemployed Americans (chart below).
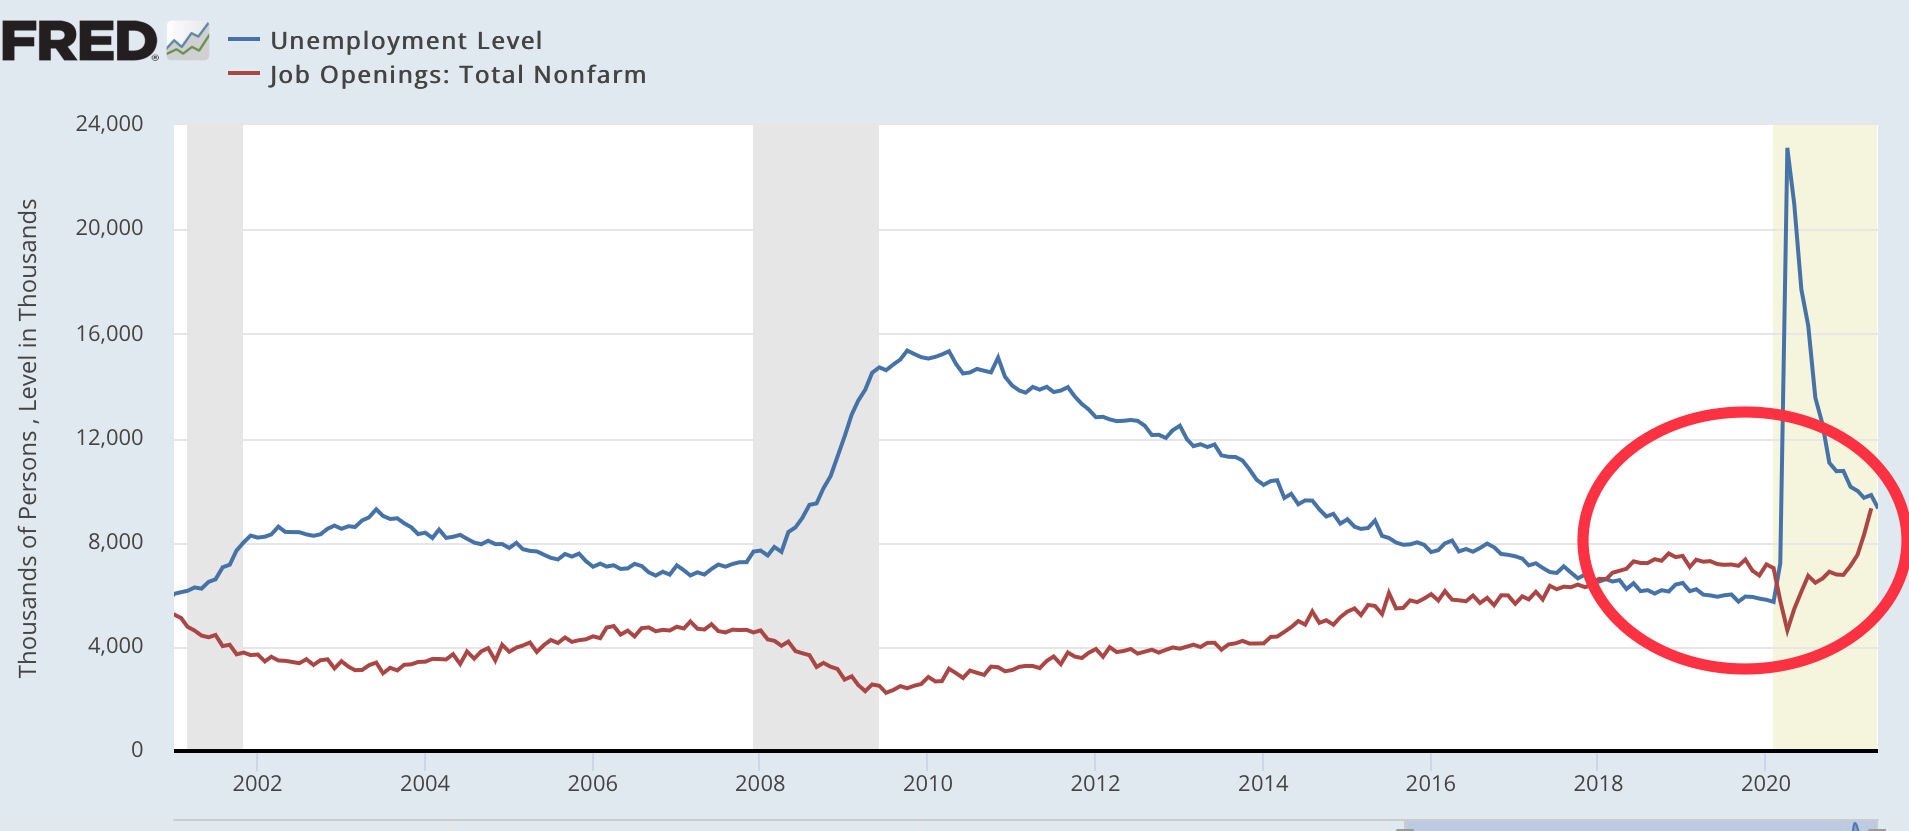
The only time this has happened before in 20 years (when job openings data started being compiled) was in 2018-19, when the economy was, of course, very robust and the Fed had started to raise interest rates. Fed funds were raised from 0.4% to 2.4% (now at 0.05%) and the 10-year treasury was at 3.2% (now at 1.50%).
Does the Fed have no shame hiding behind the payroll numbers fig leaf? Well, no, because there isn’t even that, as we see above: every single unemployed American can have a job, immediately.
I don’t believe the Fed is clueless or incompetent - obviously not. I’m even willing to accept (hope) that it’s not in the politicians’ back pockets, doing their bidding to carry favor.
Which, then, begs this question: does the Fed know something that we don’t, maybe about the coronavirus? Because I fail to see anything in today’s red hot economy to justify its current inflation-objector stance.
Those of us who lived through double digit inflation may easily dismiss 2% or 3% annual price increases as benign - and for as long as our money earns interest at or slightly above, that's OK. At least we are not losing purchasing power. Here is a chart, a reminder of what various levels of inflation does to $100 over the years.
I deliberately chose 30 years as the ending point because bonds and other such fixed income investments are heavily bought by pension funds who, by definition, have very long term investment horizons.
Our Fed claims that CPI inflation, currently running at 5% annualized, well above the yield of 30 year treasury bonds (currently at 2.19%) and way higher than Fed Funds (essentially 0%), is just transitory.
On the chart below you can see that until now bond yields were always higher than inflation, and so were Fed Funds, for the most part. That's what you call monetary rationality. Today, we are off the charts on loony money policy, however.

And why is the market not "killing" bond prices, driving yields higher? Because (a) the Fed is constantly in the market buying bonds, thus supporting prices at unreasonably high levels and (b) ultra low short term rates encourage banks/traders to play the "carry" game by borrowing at near 0% and holding bonds that pay 2.19%. That's at least 2% profit free and clear - with high market risk, of course, should bond prices drop.
But what about those pension funds, the buy and hold long term investors? They are in a bind: what kind of pensions are they going to be giving out in the future? As things stand right now, at minus 2.7% their $100 investment in bonds will be worth a mere $40 in real terms after 30 years !! A really terrible deal for their pensioners, criminal almost.
So, unless the Fed is 100% correct and inflation drops back to 2% or less very, very soon why would ANY pension fund want to buy and hold bonds? And, remember, they are by far the largest and most solid, real money investors in bonds - and that includes the Social Security pension scheme.
In my last post I laughed at the notion that "This time it's different" when it came to money creation, inflation and asset bubbles.
Well, I was wrong - because this time IS different: it's much worse.
There has never been a time in History when the world's major central banks/monetary authorities were so astoundingly "loose" (to use a polite term), creating a bubble so far reaching across all asset classes and with the participation of all social and age groups. It is no longer a mere bubble, but a bona fide mania stoked by the power of social media. Which, in turn, are most certainly and obviously being exploited by those who have most to gain by this PsychoBubble - the scammers, pump-and-dumpers, carnival barkers. Not to mention the legitimate brokers, investment bankers and asset managers who are raking in hundreds of billions in commissions and fees.
Here is what is worst, this time: the printing of trillions of US dollars and EU euros is undermining their future as reserve currencies. So far we have not seen any major currency devaluation because they cancel each other out, ie there is no other major global currency out there to compete with them. So far..
Because China and its yuan are lurking and preparing to pounce.
It is certain that China wishes to become the next global superpower, supplanting the US (the EU is not a superpower, it's an agglomeration of separate economic interests that try to steer a common direction, mostly failing). It was the world's first real global economic superpower, it invented paper currency and the first weapon of mass destruction (gunpowder). It even invented a central bureaucracy (mandarins). So, it has the historical/social background and understands its context. Furthermore, excluding the loony Mao era, China has always been a truly capitalist, mercantilistic society driven by the quest for profit.
Where is China today? It is the world's largest economy in Purchasing Power Parity terms (PPP) and second in absolute GDP. Its GDP has grown astonishingly fast, from less than 10% of US GDP in 2001 to over 70% today. At the same time its share of global GDP has gone from 2% to 18%.

China GDP - Billion USD
Let's get this straight: China can no longer afford NOT to issue and maintain a global reserve currency. It cannot stay competitive without one, it cannot control, purchase, manufacture and market raw materials, products and services around the world without making the yuan a global reserve currency, starting with removing all trading restrictions, while - like the US and EU, after all - maintaining a strict control over its monetary policy.
Obviously, it needs to do so, and soon because its economy is simply too large to continue prospering without a reserve currency. There is absolutely no question in my mind that it also wants to do so, strategically.
Two questions remain: a) can it do it? and, b) how will it do it?
a) Can it do it? Yes, of course. Being the world's largest exporter of just about everything the rest of the world buys, it has a ready-made existing demand for its currency. All it has to do is to invoice in yuan instead of USD or EUR. Likewise, it is an importer of enormous quantities of raw material and luxury goods, so trade balances can be "square" with many of its trading partners, if not with the US (that's America's and the dollar's obvious Achille's heel).
b) How will it do it? In a word, carefully but most likely suddenly when conditions are right. In fact, it is already carefully preparing to do it. Since 2005 China abandoned its fixed exchange rate policy and sharply revalued yuan from 8.3 to 6.3 per dollar. Very tellingly, the yuan has appreciated strongly since 2020, ie in the midst of the largest ever USD printing in history, going from 7.2 to 6.4 per USD.

Yuan (CNY) vs USD
Unlike the Fed/ECB which maintain very negative real interest rates, PBoC's benchmark one year loan rate has been stable at 3.85% for over a year. Given China's inflation of 2.5%, real rates for CNY are currently well above those of USD and EUR. In other words, it pays to hold CNY instead of USD or EUR - and that's one of the major requirements of a global reserve currency.

PBoC Benchmark 1-Year Loan Rate
Back to how/when? Clearly, Chinese authorities must be worrying about the ultimate value of their massive US Treasury holdings. Their exporters are selling enormous amounts of real goods to US and EU customers, only to receive (mostly) IOUs denominated in currencies that pay zero or even negative rates. How long can this continue? How long will China continue to, in essence, subsidize American and European consumers and governments? And, adding insult to injury, America in particular wants to impose trade restrictions, import duties, etc.
China's leadership may have viewed Trump as a loony outlier and waited him out, but it certainly cannot do so with Mr. Establishment Biden. Unfortunately, Mr. Biden is even more aggressive in deeds, if not in words, against China. His trillions in new "liquidity", his plans for even more in the next few years and his Treasury/Fed's stubborn insistence on huge QE at zero interest rates must have Chinese leaders seriously concerned about the dollar's viability. Add that to being blamed (rightly or wrongly) for the COVID pandemic and the mix is getting highly toxic.
Bottom line: China could decide to pull the trigger at any time. Yes, an Empire desires global stability above all else. But first, it must rise to the top by toppling the previous one. The US is currently asking for trouble by sticking to an incredibly irresponsible fiscal and monetary policy, well after the COVID emergency has passed.
So, this time around the Bubble is much worse because it comes with a very real possibility that its mishandling will end up in the Sudden Death of the American Empire.
One last note and chart. The Fed’s overnight reverse repo reached a record $535 billion yesterday, thus removing almost 5 month’s worth of QE (currently at $120 billion/month). In this reverse repo banks lend money to the Fed for 1-3 days (weekends are Fri-Sun) at a set 0% in exchange for Treasury Bill/Note collateral.

One chart today. Core CPI inflation (monthly, annualized - blue line) and the effective Fed funds rate.(red line).

For decades the Fed mostly kept its interest rates higher than or in line with inflation, since price stability (ie safeguarding the value of the US dollar) was its primary mission. The red line was almost always above the blue line.
All that changed when the Great Debt Bubble burst and the Fed/Treasury stepped in to save the banks, brokers, and the US credit-dependent economy from collapse. Things were so bad that the Fed had to keep rates at zero for a long time (yellow circle). (Aside: 99% of the people still think this was due to the US sub prime mortgages only… false: it was a global Debt/Asset Bubble in everything: mortgages, corporates, sovereigns, real estate, stocks, derivatives, insurance, credit ratings... it was a huge mess. And, in fact, it hasn't really gone away.}
So, when the COVID crisis hit what did the Fed/Treasury do? More of the same, but this time ALOT more. The global economy is now so completely awash with dollars and euros that they are channeled to ridiculous “assets” like NFT “art”, meme stocks, dubious cryptos and all kinds of commodities. Naturally, inflation has surged to 40-year highs. For the time being, anyway.
What is the Fed’s exit strategy from unprecedented QE? It is best described as a wish and a prayer: they wish inflation goes away soon, and pray to Modern Monetary Theory that it does so.
And this is the best short description for MMT: Inflation? Naaaahhhhh… this time it’s different.
Curiously, there is another country and its leader who, broadly speaking, think (wish, pray) along the same voodoo monetary policy lines. Turkey’s Mr. Erdogan believes that low interest rates reduce inflation(!!). Results so far? Inflation is over 20% and the Turkish lira has lost 30% against the dollar in just one year. Aaahhh … but the US isn’t Turkey. IS IT? No it isn't - unless and until China makes a move and wipes out the US dollar in one fell swoop.
More on China, the yuan/dollar situation and history's lessons in another post.
The Fed continues to claim that the torrent of cash it creates each month ($120 billion) is necessary because the economy is still … dunno… weak?? Seriously?
I mean, look at the current all time record in job openings. They just hit 9.3 million (versus 8.8 million officially unemployed) because people are, basically, dis-incentivized from going to work. Current unemployment benefits easily cover, or even exceed, take home pay in many sectors such as restaurants, hotels, entertainment, etc. Guess what else is going on: people are also working off the books AND receiving unemployment, ie double dipping at 5he Fed/Treasury punch bowl.

Doesn’t Anyone Want To Work Anymore?
On the Fed/Treasury money torrent:
1. Ms. Yelled just said that higher interest rates may be a good thing.
2. The Fed reverse overnight repo is at approx. $485 billion. So, with one hand the Fed is adding $120 billion per month “permanently” and with the other it is removing 4 months’ worth “temporarily”. An untenable situation, obviously.
==> Conclusion, IMHO? The tapering process has started, even if with the tiniest baby steps.
On Cryptos:
1. The US government identified the digital wallet used for the pipeline Bitcoin ransom payment, reached in and got most of it back. Doesn’t look too “crypto” to me, eh?
2. El Salvador wants to make Bitcoin legal tender. El Salvador, not, say, Japan…
==> Conclusion, IMHO? The crypto insanity mania is over, from now on only fundamentals will rule their prices. Most of them (like 99%) will become worthless.
On financial markets:
Deutsche Bank just came out with a scathing critique of printing money, predicting inflation will not be a passing phenomenon and will cause the Fed/ECB to raise rates sharply later, leading to a deep recession. Deutsche is very much going against Wall Street conventional wisdom which, predictably enough, wants the party to keep going.
==> Conclusion: Deutsche joins a growing list of heavy hitters such as Dalio, Kravis, Grantham, Summers, Druckenmiller and Gross. Who’s on the other side? Goldman and millions of froth in the mouth Reddit “investors” who plunge into (basically worthless) meme stocks and cryptos. Oh, fun… (not!).
Forget everything you know about bubbles, delusions and manias. Today’s “free markets” (forgive me Adam Smith) are psychotic, at the very least. They are no longer economic, social or even psychological mechanisms or phenomena, but case studies in clinical neuropsychiatry. Case in point: DubaiCoin (chart below). Within just four (4) days from May 26-29 it went from $0.08 to $1.80 and back to $0.20. That’s a gain of 2,250%, followed by a drop of 84%, all in four days. And as of this posting it is at $0.30, a subsequent gain of 50%.

Heavy Meds Needed, STAT!!
Yet, that’s almost rational when compared to the invisible sculpture that was auctioned for 15,000 euro last month. That’s right, invisible as in empty space, thin air, niente, nada, nothing. It even comes with instructions on how it should be properly displayed. I’m not kidding, read and laugh - or weep.

Money For Nothing- Literally
I said that there’s too much money around chasing all kinds of “stuff”. Now, money is even chasing nothing and is used to price nothing. Ergo, what is the value of money? Yup, it ain’t what it used to be...
Taking this a bit further, if nothing is priced at €15,000 it follows that something’s price should be higher. A cup of coffee for $1,000,000? A dozen eggs for a barrow-full? Why not, it’s not like we haven’t seen it before,. But, hey, let’s keep printing it can’t happen here, right?

One Dozen Eggs, And Keep The Change -PLEASE!
We have become so accustomed to cheap money that the very oxymoron “cheap money” no longer rings alarm bells. Zero interest rates? No problem. Negative interest rates? No problem. Seriously??? Money should not be “cheap”, it should not be free (as in pouring down on everyone) and it most definitely should not have an absolute negative “carry” (as in negative interest rates). Otherwise.. why should we even possess it, hold it, amass it?
Get this straight: when (mind you, not if) someone comes up with the realistic reserve currency alternative, the dollar is history, and most likely so is the euro. And by realistic I definitely do not mean cryptos, NFTs, imaginary art or even precious metals. I mean the Chinese yuan, which is very carefully and deliberately being prepared to dethrone the dollar.
I don’t know when China will pull the trigger - but pull it will. Pay careful attention to what China is doing. It is banning cryptos, tightening credit conditions, warning of asset bubbles. Contrast that with the Fed and, sadly, the ECB. China is preparing the yuan as reserve currency of choice; it already has ready customers fit it, since its trade surplus is gargantuan. All it has to do is make the yuan freely tradeable and require payment in yuan for its exports. It’s going to happen...
Meanwhile, back in Rome - sorry, I meant Washington - politicians are bathing in hubris, never for a moment worrying about a sudden collapse. Hint: ask Gorbachev what he thinks...
I am a great fan of behavioral, as opposed to “classical” economics. Richard Thaler’s Misbehaving (2015) is one of the few economic theory books that I truly enjoy reading. The author went on to win the Nobel Prize in 2017, so he’s no slouch.
In a nutshell, the main premise of behavioral economics is that people make decisions based mostly on fast, emotional reactions (gut feelings) instead of rational analysis. Importantly, this premise has been tested and proven on the field in hundreds of experiments - unlike “classical” economics which is mostly based on theoretical econometric models.
Thus, we are in fact not homo economicus. Despite this, almost every economic theory in the world is based on a strict human “rationality” that just isn’t there.
So... will the current unprecedented monetary flood taking place in the US, EU and UK affect economic behavior? And if so, how? It’s important because these economies combined account for about 40% of global GDP. Furthermore, how will this behavior affect China, which accounts for another 20%?
First, let’s look at the size of new money creation. I’m using the US as a proxy because of its global economic power and because the dollar is (still) the undisputed reserve currency of choice.
Within just one year the US has exploded money creation (M3) from a bit under $1 trillion per year to $4 trillion (chart below). The Treasury/Fed has “printed” more dollars in one year than the previous six years combined. This shock to the system is surely altering people’s behavior - but, how?

US Dollar Money Creation Explodes Upwards
For one, direct payments to all Americans (helicopter money) is causing a labor shortage, mostly at the low end of the income scale. Even though this heli money was definitely a one off, people are behaving as if it will go on forever. Those who “rationally” need jobs and income the most are being offered jobs, but choose to remain unemployed.
Another effect is the immense popularity of extreme speculation. Millions who got heli checks are not using the money for insurance against uncertain times but for wild bets on meme stocks and dodgy cryptos, despite acknowledging that their actions are highly irrational.
The Fed/ECB/BOE themselves acknowledge that such enormous money creation leads to higher inflation (and CPI/PCI are already spiking up), but choose to continue pumping more money into a flooded system. How rational is that? (Unless, of course, their ultimate goal is to create high inflation..).
Put those three observations together... those of us who know market history understand that markets can exhibit irrationality, particularly at their manic, delusional stages. Even Adam Smith understood “animal spirits”. But, right now, this irrational misbehavior is extending to the entire economy. From workers choosing to remain unemployed to central bankers refusing to perform their monetary policy duty, this irrational behavior is gripping the entire economy.
This situation looks to me like a train going downhill at breakneck speed towards a dangerous bend in the tracks. Its passengers are flushed with the thrill while the engineers are stoking on, never mind the brakes..
We have gone way beyond Mr. Greenspan’s partial irrational exuberance, we are now in total Misbehavior Economics territory..