Tuesday, June 28, 2022

The Twilight Of Empire

The early part of the 20th Century saw the concurrent collapse of four empires and the rise of another to supersede them all. The British, Czarist Russian, Austro-Hungarian and Ottoman empires became victims of WWI, and from their ashes rose the global might of the United States.  Its pre-eminence was briefly challenged by the Axis powers during WWII and the USSR during the Cold War, but they all shattered under the overwhelming might of the American economic juggernaut.

America originated as a loose gathering of opportunists, but it found cohesion through a visionary political system and revolutionary Constitution, both designed by its brilliant Founding Fathers.  In the absence of common culture, religion, history, or even a common language, the nation was built entirely upon a common set of laws and a unique balance of power among the three Estates. It worked well, until the deeply unequal prosperity between the industrializing North and the agrarian South led to the Civil War. Its aftermath made industrialization the new norm and rapidly created what has held America together ever since: the common prosperity of its mighty, upwardly mobile middle class.

It was the astonishingly rapid rise of this prosperous middle class that begat the myth of the American Dream. Mind you, I’m using myth in its Ancient Greek interpretation  of  mythos, ie a morality tale, and not today’s meaning of “unreal story”. The American Dream was, however briefly as History goes, a very solid reality evident in the high living standards of most American households. Rising from the abject poverty of late 19th Century city slums to the detached homes of 1960s suburbia, America’s middle class was mythical, indeed.

The common prosperity of the middle class is now gone.  I won’t produce statistics as proof, though I certainly could;  all I need to mention is MAGA as the Presidential race slogan - emphasis on Again. So, if not a common prosperity, what’s left to keep the Nation together?  Why, the original glue, of course: the Constitution and the balance of power between the Executive, Legislative and Judicial Estates. How are they holding up? In a word, terribly.

  • Starting from the Constitution, the three most recent Supreme Court decisions on guns, abortions and public school prayer clearly show that the Court has completely lost touch with society and become highly politicized - even downright partisan. Our society depends on laws that keep pace with the times, not literal interpretations of codices and scriptures written eons ago. 
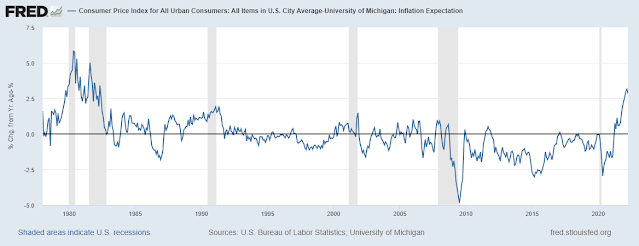
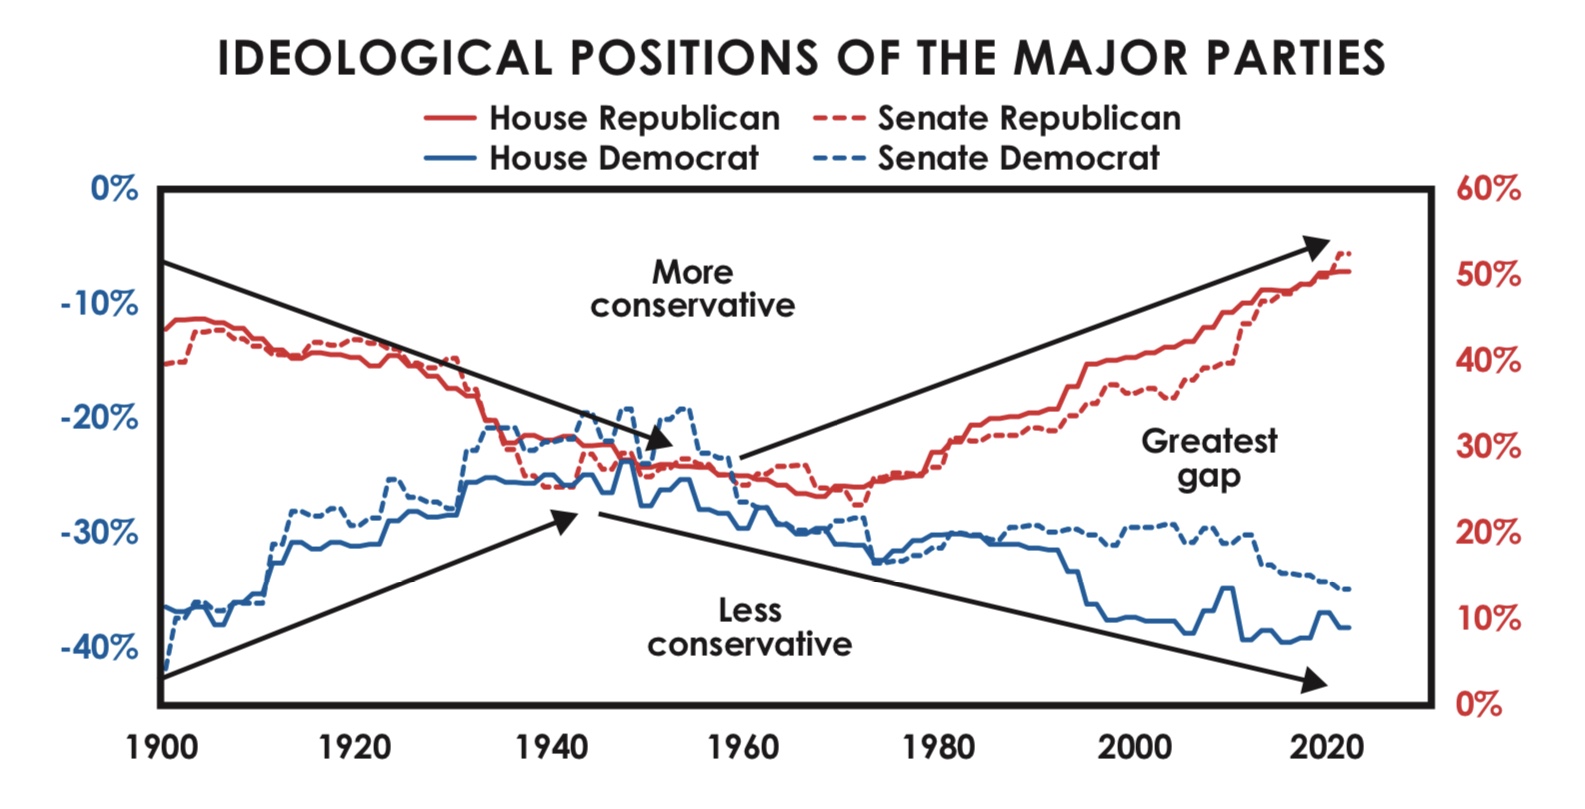
  • The Legislature is polarized in the extreme (see chart below, from Ray Dalio), and has no parliamentary traditions to create workable consensuses. America’s political system is winner-take-all, unlike in Europe where multiparty governments are the norm.
  • The Executive branch has become increasingly imperial. Following almost precisely the ancient Roman timeline, Reagan and Clinton were as Julius Caesar and Augustus, our Tiberius is a combination of Bush and Obama,  and Trump is our very own Tweeter-manic Caligula. And he  has been succeeded  - just as in Rome - by the old, feeble, stuttering Biden as our Claudius. It seems that US history is suffering from Imperial Repetition Syndrome.
  • The Judiciary is still doing ok, I guess, but even there landmark decisions on socially sensitive issues follow political lines.  There is always more publicity around SCOTUS, but there are hundreds of significant decisions from State courts, and they show a marked influence by politically powerful lobbies.

My conclusion, sadly, is that America's Empire is on the wane.  To paraphrase, "it's twilight in America".

Saturday, June 25, 2022

Real Earnings Crashing Through The Floor

When the data changes faster than the scale which measures it, you get the chart below.

Crashing through the floor, the real (inflation adjusted) earnings yield of stocks is at a 70 year low. I’m almost certain it is an all time record low, too, I just don’t have a chart going back to the 18th century.  


The fundamental question is, can companies raise prices for non-essential goods and services faster than their input costs? Can they raise prices faster than wages? Can they raise their earnings faster than inflation? IMHO, no way. 

Thus, we all better be prepared for much lower P/Es going forward.


Friday, June 24, 2022

Inflation: Expectation vs Reality

The University of Michigan publishes monthly surveys of year ahead inflation expectations. Right now, people think it will be at 5.4%, well below today's 8.60%.  The chart shows this expectation (blue line) and current inflation.  It's a pretty good fit, for the most part. If anything, people are more conservative in their predictions than reality.


In the next chart, I look at the spread between current inflation and prediction - see chart below. It is now at the highest level since 1982, ie people are still predicting/hoping that current high inflation (8.6%) will come down fast.  But, the last time people's predictions were this optimistic (1980s) they were proven dead wrong as inflation soared to near 15%.

Only time will tell what will happen, but for now I'll go with "hope dies last".

Thursday, June 23, 2022

Inflation Fear Grips The Nation

Just came across these charts from the Michigan Survey of consumer sentiment.  

I'm used to vertical take-off charts, but this is stunning, even for me.  Americans must be scared out of their minds about inflation, with their mood swinging violently from utter complacency to strong concern in a manner of weeks.  

Another chart from Michigan shows the fastest ever deterioration in financial expectations, particularly among males.

My conclusion is that consumers must already be stepping hard on the spending brakes for anything other than essentials. Latest data on the charts are from April 1, 2022, by the way.  

Wednesday, June 22, 2022

Risk Premiums Still Low

Risk premiums are a common way to assess where we are in the economic cycle or, more accurately, where the market thinks we are.  Premiums bottom out when the economy is strong and top out at the bottom of a recession.  Right now, the spread between returns on high yield bonds and 10-year Treasurys is rising, but it is still very far from previous cycle highs.  Meaning, investors are still not worried about a significant recession that would lead to corporate bankruptcies.

The charts below from Yardeni Research make things quite clear: excluding the Great Debt Crisis of 2008-09 which saw spreads rocket to over 2000 bp (20%), spreads usually top out around 800-1000 bp (8-10%).  Today, spreads are still only at 500bp.

Another way to look at it is this: with junk bonds yielding just 8.45% and inflation at 8.60% a junk investor is not being compensated at all for assuming the extra credit risk.


Tuesday, June 21, 2022

Chart Gazing - Nasdaq Composite

It is rare to find "picture perfect" technical chart patterns, and I'm always suspicious of them when I do.  But, sometimes, a cigar is a cigar.  Without further comment, an annotated chart of the NASDAQ Composite index.


Monday, June 20, 2022

Quantitative Tightening

I know I sound like a broken record. But on the subject of the Fed and ECB as inflation fighters, I shall repeat my mantra: It's the QT, the QT, QT - and not just interest rates.  

Money, and everything else that trades from microchips to potato chips, has TWO measures: quantity and price.  Interest rates are the price of money, money supply is the quantity of money. Central banks are responsible for regulating both, not just interest rates.  Particularly since they went bonkers with Quantitative Easing during 2020-22.

The chart below shows the weekly change in the Fed's balance sheet assets - at one point it was adding $400 billion of fresh money per week!  It has since eased off, but it is still adding and not subtracting liquidity to the system.

Therefore, I will know that the Fed is serious about combating inflation ONLY when the line on the chart dips well below zero and stays there for the duration.


Markets are still focusing almost entirely on rate hikes.  No one I know is even thinking about QT as a factor that will affect the market.  But as we saw a week ago in the Italian and Greek government bond markets, the ECB's pause in buying their bonds sent their yields rocketing upward, and panicked politicians immediately pressured Mrs. Lagarde into promising some sort of "tool" to protect the hapless South.  It is still unclear what she will do and what effect, if any, her "tool" will have.


Italy Government Bond Yields Rocket Upwards

Sunday, June 19, 2022

Crypto: Crash And Consequence

To paraphrase, nothing exceeds like excess.  In March 2020 the total market value of all cryptocurrencies was $141 billion.  Less than two years later, in November 2021,  it had exploded to almost $3 trillion, a 20-fold increase that was part and parcel of the “everything bubble” created by the printing presses of the Fed and ECB.

As expected, cryptos are now collapsing faster than any other “market” segment. Speculative frenzy has been replaced with fear, FOMO (fear of missing out) has become FOLIA (fear of losing it all).

Will the Crypto Collapse have consequences beyond its own backyard? Yes, of course: not only will it freeze risk appetite for everything (crypto has become a sort of mania weathervane), it will also create a cascade of cross-collateralization margin calls for all financial assets.  The crypto market capitalization at $3 trillion was just too big and juicy to ignore as a source of collateral to carry other positions in stocks, commodities, etc.

In a hypothetical case, a speculator who owned crypto worth $1 million could have used it as collateral to buy stocks worth as much as $1.8 million (90% crypto margin, 50% stock margin) - that’s leverage of 1.8X.  Worse yet, the $900.000 from the crypto loan could be used as margin to buy stock futures, thus raising the leverage to 14X.  But, it could be worse still: instead of futures, the wild-eyed speculator could buy CFDs (Contracts For Difference) where leverage can be as high as 50X.  

It is all somewhat reminiscent of the derivatives’ alphabet soup in 2004-08, where huge leverage also wiped out hundreds of billions in “value”, initially starting from pools of speculative real estate and its associated mortgages.  

The underlying, entirely false, assumptions for crypto and junk mortgages were  the same: real estate mortgages don’t default, and crypto is just as good as cash money in the bank - or even better. The reality is that they were both highly speculative trading sardines.  

The crypto collapse is a catalyst accelerating events on the downside, so I won’t be surprised if I hear that some big names are caught in it.  El Salvador comes to mind…. I mean, can you just imagine? An entire country bought trading sardines, won’t  there be at least a few big institutions out there that bought them too? Or, as Warren Buffett puts it, as the tide recedes we will find out who’s been swimming without a swimsuit.


Saturday, June 18, 2022

Watch What I Say, Not What I Do

These are truly weird times. In fact, it is the only time in my memory that it makes more sense to pay attention to what people are saying, instead of doing. Allow me to explain.

On the first chart we see that consumer expectations are at a record low, on the same level as the dark days of 1970s double digit inflation, the 1987 Crash and the Great Debt Crisis.  Notice how Americans’ expectations dropped during the pandemic and then recovered slightly, only to plunge to the bottom immediately after, despite the trillions showered upon them by the Government/Fed.


And showered by trillions they were, indeed.  Household financial assets jumped by an incredible $30 trillion in a matter of months, the largest increase in the history of the United States - see chart below. The country’s entire annual GDP is approx. $25 trillion, so it’s as if all of it - and more - went into peoples’ pockets as cash and financial asset appreciation. That’s absurd - or rather, absurdly sudden and very, very dangerous.

Household Financial Assets Soared

Americans became InstaRich (or felt like it), and naturally acted like it, spending with abandon. After a brief collapse during the pandemic, retail sales exploded upwards.


Retail Sales Explode 

If there ever was a case of “watch what I do, not what I say” this would be it, right? Yes - up to now. 

Because, things are now getting seriously ugly at the consumer inflation front, hitting Americans very, very hard where it hurts most: housing (mortgage rates have doubled), energy and transport (gasoline, electricity, heating and automobile prices are up 30-50%) and food (up 15-20%).  Things are also getting very ugly at the stock market and cryptos, the unfortunate choice of many amongst the younger generation who have not experienced bubbles and their eventual sad outcomes. 

So, this is why I think we should pay attention to what Americans “feel”: when people ultimately (soon?) combine their record low sentiment with present market ugliness destroying their InstaWealth, and then act on it,  we may very well get a sudden denial to spend on anything and everything. We may also get a sudden rush for the markets’ exits in order to preserve whatever wealth can be preserved. 

Bottom line: It is weird in the extreme to have record high household wealth, record high retail sales AND record low consumer sentiment, all at the same time.  This situation will normalize, and it could do so  abruptly - thus the dangerous part.

A final note: how is record low sentiment and record high wealth even statistically possible? I believe there is only one possible explanation: sentiment is measured for 330 million Americans, but wealth is concentrated at the top 1% of the population.  In other words, the Gilded Age in extremis. Can the 330 million affect the wealth of the top 1%? You better believe they can, when they stop buying high-value, high-margin “unnecessary” items and services,  and also stop being the marginal “top-of-the-bubble buyers” of stocks and become the “get-me.out.now” sellers. 


Thursday, June 16, 2022

Some Perspective On The Fed Rate Hike

 The Fed raised rates by 75 basis points yesterday (0.75%), and the media focused on it being the "biggest increase since 1994".  Sounds like the Fed is really fighting inflation, right?  I think some perspective is necessary, before we start applauding...

As always, a picture is worth a thousand words:


CPI Inflation (blue), 2-Year Treasury Yield (green) and Fed Funds (red) 

You will be excused if you can't quite see the Fed Funds line today, because it has barely budged from the bottom, despite that "biggest increase since 1994" (ok, it should be a smidgeon higher at 1.50-1.75%).  But, ok, the market is already discounting a couple more rate hikes, to about 3.50% - that's the green line, the yield on the 2-year Treasury, often used as a proxy for where Fed Funds will be in 12 months.

Last time inflation was at today's levels, Fed Funds and the 2-year were both at around 8%.   Can it happen again? Well, unless inflation cools off immediately to 5% or less I can't see how we can avoid it. Thus, the trillion(s) dollar question is, will inflation cool off immediately to 5% or less?  Honestly, I cannot see how it can happen, without persistent quantitative tightening (QT) and a significant, demand-destroying recession.

Banks and large institutional investors, ie those who have access to the Fed's reverse repo facility (an overnight deposit to the Fed collateralized with Treasurys), are voting loudly with their money.  The reverse repo amount now stands at $2.16 trillion, a new record, as money seeks the safest haven possible from credit and interest rate risk.

Reverse Repo Amount Soars To Record

===> And just as an aside, European Natural Gas prices soared to 118 yesterday, up from 85 a couple of days ago, as Russia announced it will cut deliveries through the Nordstream pipeline by 30% "to repair compressors".  Prices were at 18-19 a year ago.  No, I don't think inflation is going away any time soon.

European NatGas Price Jumps

Tuesday, June 14, 2022

Revisiting The Greenback Idea - Its Time Has Come

 I first broached the idea of the Greenback as a thought experiment in this post dated February 1, 2008.  It stated: “The money supply of the United States shall be indexed to the production of renewable energy and the dollar shall be renamed the Greenback”.

It was an idea ahead of its time.  After 15 years, it is finally happening, albeit in a minor and roundabout way: ESG bond issuance is becoming increasingly common and popular. Alas, it is also used as a way to “greenwash” a multitude of environmental and portfolio sins. Still, it’s a step in the right direction.


Today, I will quantify my Greenback suggestion.  

Renewable energy currently makes up 12% of all US energy production/consumption (2021 data).  I propose that annual Greenback money supply growth should not exceed the incremental annual growth of this renewable energy percentage. For example, if renewable energy grows from 12% to 13% in a year, Greenback supply growth should be limited to 1%.


Yes, it’s very different from today’s monetary regime and will pose a huge problem for the Permagrowth socioeconomic paradigm. Actually, it will put an immediate end to it, which I believe is necessary to avoid an environmental and human habitat collapse.


In one crucial way, the Greenback is similar to the US dollar: it, too, is tied to energy. The dollar has been tied to crude oil (and increasingly natural gas) ever since FDR’s meeting with Saudi Arabia’s King ibn Saud aboard the USS Quincy in 1945. (The minutes of that meeting are still sealed 77 years later, by the way.)


The US Dollar Gets Tied To Crude Oil, USS Quincy, Feb.1, 1945

The Greenback’s benefits:

  • Promotes real economic development, instead of mere expansion.
  • Eradicates inflation.
  • Encourages fiscal responsibility.
  • Makes monetary policy steady and predictable.
  • Boosts scientific R&D.
  • Hastens transition to a Green and Sustainable economy.
  • Allocates scarce capital more rationally.
  • Last, but not least, it allows for a drastic reduction in defense spending, the vast majority of which goes to safeguard oil and gas supplies and their global transportation routes. Imagine the benefit of even half of the annual defense budget ($600 billion) going towards building a renewable energy infrastructure. 
The dollar as it exists today is an anachronism. Long live the Greenback!

PS To be clear, the Greenback is not a new currency.  It is the regular US dollar, but “anchored” to renewable energy, instead of oil and gas. 

Monday, June 13, 2022

The Fed Is Very Far Behind The Curve - Hard Landing Inevitable

 Sometimes a single picture (or two) can fully answer the two questions currently on everyone’s mind: 

  1. How far behind the tightening curve is the Fed? - VERY
  2. Can it really engineer a soft landing? - NOT BLOODY LIKELY
Here is the proof, in one picture.


The difference between 2-year Treasury yield and CPI inflation is at a 42 year negative record low (red arrow). I’m using the 2-year Treasury yield as a proxy for where the market believes Fed Funds will be by the end of 2023 (approx. 3%, up from 1% today), if it keeps the current schedule of tightening.

So, the chart tells us that:
  1. There needs to be much more tightening to bring real rates back to normal, ie the Fed is very far behind the curve and,
  2. So much extra tightening will inevitably result in a recession, ie a hard landing. For comparison, look at 1980.
As for quantitative tightening (QT), the Fed hasn’t even started yet. The second picture shows that Fed’s balance sheet assets (Treasury and mortgage bonds) are at 36% of GDP, the highest ever.  This translates to $9 trillion of excess liquidity pumped into the economy which needs to be removed, at least partly, if inflation is to be tamed. The Fed has indicated it is willing to start by removing about $90 billion/month, or 1% of the excess every month.  It will help fight inflation, but not by very much - significantly more needs to be removed.  

So, two charts, same answers: the Fed is very far behind the curve and needs to be very aggressive to fight inflation, resulting in recession.  Does it have the guts to do so, as Volcker did 40 years ago? I doubt it, but let’s give Powell the benefit of the doubt 😜


PS To be clear: the Fed needs to remove an amount equal to approx 12% of  GDP in liquidity from the system. The faster, the better - but don’t hold your breath, you will suffocate waiting.


Sunday, June 12, 2022

The Great Debt Crisis And Today

 If you started reading this blog in late 2006 you know that I was puzzled and worried by the escalation of sovereign and private debt, the explosion of real estate prices, the proliferation of tranched mortgage bonds and leveraged credit derivatives.  Today, many have forgotten that the trouble was not isolated to sub-prime loans. There was excess everywhere, from FNMA and GNMA all the way to government bonds, real estate and consumer banking in PIIGS (Portugal, Italy, Ireland, Greece, Spain). 

Greece, Lehman, Nationwide Savings and many more went bankrupt, Cyprus  seized bank deposits over 100.000 euro, Iceland reneged on all foreign investors, AIG, Merrill Lynch and others were bailed out or forced into shotgun mergers. Yeah, there was much more trouble than people remember. The movie Big Short, though quite accurate, described just one aspect of the excess (sub prime loans and derivatives).

Yet, compared to today the Great Debt Crisis (GDC) was a walk in the park.

In many ways, GDC never ended - the real problems were just swept under the carpet. The ECB hasn’t raised rates in over a decade and many countries “enjoyed” negative interest rates. Money policy-wise, we have been living in party-hardy times for a very, very long time. I would dare say an unconscionably long time, if it wasn’t for the pandemic, which panicked governments into taking monumentally unwise actions.

In sum, zero interest rates for over a decade, plus gigantic money creation in 2020-22 resulted in:

  1. Enormous risk appetite. Basically, people threw money at everything, including truly moronic “assets” .
  2. The creation of an ocean of money supply, the fuel for inflation which has now ignited.
  3. The unshakeable belief that central banks will always come to the rescue, no matter what (the so-called Fed put).
Today’s problems are systemic and widespread.  They go to the very heart of monetary economics and policy, as practiced by governments and central banks in the US and EU who no longer consider money as a storehouse of value. They use it as just another expedient political tool, a sort of socioeconomic panacea, a cure-all whipped out for each and every malady.  

And why? Because truly effective macroeconomic political solutions have become impossible to enact, or even propose. 
  • The US is deeply divided politically, economically and socially. Inequality is back to 19th century levels and the working middle class has been eradicated.
  • The EU is a hodgepodge of completely unequal sovereign nations bound together by the euro straight-jacket.  Well intentioned, but terribly executed.
In the absence of coherent political leadership, everything and anything is thrown to the Fed and ECB, whose heads have become mere compliant figureheads.  Instead of facing reality, they have come up with Modern Monetary Theory where money just doesn’t matter.  

In some ways the period from 2006 to now is like WWI and WWII, which we now understand to be a Long War interrupted by a period of growing imbalances leading to disaster.  We cannot make the same mistake. To wit:
  1. We have to restore the Middle Class in the West, particularly the US.
  2. We have to renounce Permagrowth globally.
  3. We have to remove financial markets’ influence on political decisions.
  4. We have to restore faith in money.
I will close with a chart. After all, a Sudden Debt post can’t be complete without one 😆😆

In the past 40 years the top 0.01% of Americans have seen their income grow 600% while the “bottom” 99% saw only a 50-80% rise. Mind you, this chart comes from the Council on Foreign Relations, publisher of Foreign Affairs, not some dubious left wing fringe.  It vividly portrays the need for #1 above.

Soaring inflation for essential goods plus much lower wage gains create a highly toxic social mixture.  I fear that Trumpism and the attack on Capitol Hill are a mere opening act; discontent could easily spin out of control into rage. 

Saturday, June 11, 2022

Money Creation Equals Inflation

 US inflation came in higher than expected yesterday, shocking (why?) markets that were feverishly hoping for some signs of easing. Everyone is now expecting the Fed to raise rates more aggressively.  The projection is for Fed funds to reach around 3.00% by year end 2023. A good estimate is provided by the yield of the 2 year Treasury, see chart below.

Yield Of 2 Year Treasury

Everyone is talking about interest rates, but they’re missing the forest for the tree.  The real issue today is money supply, and almost no one is talking about it - until very recently, that is, when Secretary Yellen vehemently denied that printing $$$^n and sending it out to every American was the cause of spiking inflation.   So, politicians are in full denial mode and are, thus, not helping in the fight against inflation.

Denial can’t negate the obvious fact that when you print trillion$$$ within months and give it out to every American for free, you will create inflation.  The more you print, the higher the inflation.  The evidence speaks for itself - see below.

Money Supply Growth And Inflation

The remedy is equally obvious: cut money supply, and do it aggressively and fast, before inflationary expectations become entrenched into commodity pricing and labor cost expectations. Notice how M2 is still rising at a near historically high annual rate (10%) which in the past produced double digit inflation. Does anyone remember which number we all agonized about, every time it was released back in the late 1970s and early 80s? Yup, it was M2….

A corollary from the above is also about markets, particularly stocks, and memes like cryptos, NFTs, SPACs, and other such crazy-money “assets”: What the money high tide giveth, the low tide shall take away.


Friday, June 10, 2022

Inflation At 40 Year High

 Shelter, food and gas, huh? I couldn’t have said it better myself…. Oh, wait - I did 😆😆


Bloomberg headline about inflation today.

A Tale Of Two Charts

Today, two charts that are seemingly telling two entirely conflicting stories.

  • When I look at the University of Michigan survey of consumer sentiment making near all-time lows, I think that Americans are morose, discontent and watching their pennies like misers.  


Consumer Sentiment Survey

  • But then, I look at retail sales zooming and I think Americans are partying like there is no tomorrow.

Advance Retail Sales

Which is true? How am I supposed to reconcile these two charts? And, more importantly, is there a hidden message?

Maybe Americans are indeed morose and are drowning their sorrows in shopping therapy.  Or, COVID is causing bipolar disorder side effects. 

Or, is it the time-tested maxim of "watch what I do, not what I say"

I vote for the last interpretation, because it fits the larger picture: an unprecedented amount of free, unearned money was thrown to the people within just a couple of months.  Money alone didn't make them happy, of course, given the nation's ongoing funk - just look at Trumpism.  But, it did give them the free "booze" to go out and parteeeee!!

What's the hidden message? It's this: The free booze is about to be taken away (Fed QT and higher interest rates), and sentiment is certainly not going to improve with gasoline reaching $5 at the pump.  How will Americans react? What will they say and do?  I think they will say : "enough!, I'm going home" and quit the party en masse.

Human psychology is odd, particularly when it comes to masses.  It can turn on a dime, even for the most imperceptible and seemingly unimportant reasons.  Like a straw breaking the camel's back, Americans could suddenly go on a buying strike because, say, gas went from $4.95 to $5. 


Thursday, June 9, 2022

Rotten To The Core - Let's Get Our Priorities Straight

 So called “core” inflation is used to measure price activity for a basket of goods and services excluding “volatile” food and energy.  Focusing on this “core” to make monetary and fiscal policy decisions is wrong, in my opinion.  After all, what is more “core” to life than these very basic necessities: food and energy.

We all absolutely need to eat, use energy and provide shelter for ourselves and our families. Sure, we also need education, entertainment, health services, travel… but only after taking care of the basics.  Bread comes before Broadway, every time.

Politicians and analysts/traders always spin statistics in ways that fit their stories; in our business we call it "talking your book", ie arguing in favor of your securities' positions (book).  In this case, if you are long bonds and stocks you avoid talking about the sky-high headline inflation, and focus instead on the somewhat lower "core" number.  Does this make sense in today's environment?  Absolutely not.

Headline (blue) And Core (red) Inflation

In the chart above we see that prior to around 2000 the two lines moved in tandem, with small differences between the two.  Since then, however, core inflation was very tame, varying very little around an average of 2-2.5% - until very recently, that is. (The reason for the flat core inflation is China's powerhouse consumer goods export machine, but that's another topic). Then came the trillions of new dollars and euros unleashed on the global economy within months - and everything changed.  

Think about it: food, energy and shelter are the real core, it is their prices that govern consumer attitudes and, ultimately, behavior.  There are just so many repeated shocks one can take at the pump, the supermarket checkout, the gas, electric and mortgage bill, before he/she clamps down on less essential spending.

So, we really need to redefine Core Inflation.  I suggest we replace it with a weighted index of Housing, Energy, Transportation and Food prices.  After all, this is precisely where Americans spend most of their money (approx. 65%).  In a previous post I calculated that in April such an index was up 11+% from last year, almost double the 6.1% reported for the current "core".

Another way to express it is let's get our priorities straight!


Wednesday, June 8, 2022

Markets In La-La Land

President Biden and Secretary of the Treasury Yellen are falling on their swords these days in re inflation.  And then again, they aren't.

They do acknowledge that "transitory" was an unfortunate term to use when describing inflation just a few months ago, but they vehemently deny that it was caused by the enormous amount of money printed and distributed in 2020-22.  Instead, they blame the pandemic, supply disruptions and - naturally - the war in Ukraine.  It is truly a rather disingenuous pass-the-blame game, because...

Inflation was already at 7.5% in January 2022 (red dot on the chart) - before the war started -  fueled  by sharp price increases in energy, food, metals and other basic commodity prices.


Inflation Soared Well Before The War

Global commodities are priced and paid for almost entirely in dollars (some are in euros, too).  Commodity production and supply is limited by physical constraints, whereas dollars aren't.  Money is created instantly by politicians (you can forget about independent central banks, they no longer exist). Thus, any sane commodity producer (Putin included) is most definitely going to raise nominal prices for his/her goods, to reflect the flood of new money sloshing about.  And that's why the Fed needs to proceed firmly and fast with sopping up the excess via Quantitative Tightening, as well as raising interest rates.

The stock market is attempting to stabilize these days, egged on by analysts who focus on core inflation ex energy and food.  Again, a disingenuous argument when people's budgets are ravaged by huge price increases on necessary items like gasoline, electricity, gas and food.  Target's announcement yesterday about inventory mark downs is very illuminating.  There will be more of that coming once the summer season is over and folks are done with spending on long-delayed vacations, eating out, etc.  A friend at a large restaurant in Florida is already reporting a very sharp un-seasonal drop-off in business, after experiencing a blow-out winter. People are definitely tightening up.

But markets are whistling past the graveyard, or living in La-La Land.  

Saturday, June 4, 2022

Average Joe And Jane Inflation

Inflation for May will be released next week and everyone is biting their nails. The April number came in at 8.2% and even a tiny tick down may result in waves of relief.  Or not.  But, that’s not the point…

Today, I present the Average Joe and Jane Inflation (AJJI), calculated as a weighted basket of absolute necessities: shelter (58% weight), food at home (14%), energy (14%), transportation excluding fuel (14%). It’s a way to gauge the impact of price hikes on those Americans who live paycheck to paycheck and cannot really afford many, or any, extras -   ie the majority of US population.  

Another way to look at it is as a predictor of upcoming consumer spending on higher margin non-staple goods and services, which makes up more than 45% of the economy and probably 70% of all corporate profits. Basically, if you have to spend more on basic needs, you can’t afford to buy much else.

For April AJJI was 11.05% from a year ago - well above the headline 8.2% inflation. And how about wages, did they cover AJJI? Not even close; median wages grew just 6.6% from last year - see chart below. Joe and Jane Average are experiencing a loss of real purchasing power of 4.5-5%, something that will definitely impact consumer spending and corporate profits.


We’ll be waiting for the May numbers, but we can already look at current prices: gasoline, food, auto and homes are making new highs as we speak.

Note: The data for AJJI come from the Bureau of Labor Statistics. The wage chart is from our good friends over at the Atlanta Fed.


*****UPDATE**** June 7... Major US retail chain Target today announced that it will have to take a charge for discounting unsold inventory, because consumers, stung by high inflation on basic items, have pulled back from buying high ticket and higher margin items like TVs and apparel.  Target stock is down 12% pre-market, for a total of nearly -50% from last year's highs.

Thursday, June 2, 2022

Keeping Track Of QT (if and when it happens)

The Fed is expected to start reducing the size of its balance sheet by allowing bonds in its portfolio to mature without renewing them, aka to start the process of Quantitative Tightening. The vast majority of its holdings are Treasuries and mortgage securities, so the chart below will be a handy way to keep an eye on what is actually going on.  It is the weekly change in mortgage (red line) and Treasury (blue line) holdings.

Looking closely, we can see that the Fed has stopped adding Treasuries (blue line at zero since April) and is edging very slightly into negative territory with mortgages. 

The bigger picture, in my opinion, is that the market is focusing on interest rate hikes almost exclusively and is largely ignoring QT.  I think, however, that today it is liquidity that is the main driver of markets, not rates.  And liquidity has not yet come down.  What will happen when it does?

I'll be updating this chart on a regular basis.


Keeping An Eye On QT


Mea Culpa - Panem Et Circenses

US Treasury Secretary Janet Yellen just said "I think I was wrong then about the path that inflation would take." Her mea culpa is certainly appreciated, but since her previous job was Chairwoman of the Fed, the statement is an understatement - to say the least.

I mean, how could she possibly believe that inflation would do anything other than soar after the Fed printed a torrent of money?  Much more money in circulation, especially when rained freely upon the populace from helicopters in a very short time, is going to push prices up - period.

Think about it like a Roman emperor, say.. Caligula.  You have been spending enormous amounts of gold aureii on debaucheries at the palace, ridiculous "naval" campaigns in manmade lakes, marrying your sister and making your favorite horse a Senator.  The people, happy at first, are starting to get angry and you must placate them, fast.  You decide to follow the tried and true (but very expensive) recipe of bread and circuses - but the Treasury is nearly empty.  What do you do? Adulterate the coinage, of course.

The grain merchants and gladiator owners are not fooled by the flood of new less-than-golden aureii and immediately raise prices.  Any similarity with today is purely coincidental. Or not.


Ave Caesar Morituri Te Salutant