Wednesday, April 21, 2021

History Rhymes, Second Stanza

 Following from my previous post, here’s the second stanza, the historic rhyme..

Although the current bubble may not look the same as the Great Credit Bubble of 10+ years ago, there are troubling similarities.  For one, Wall Street seems to have a penchant for inventing new speculative vehicles that come with initials.  Last time it was CMO, CDS, CDO (squared and cubed), while today’s alphabet soup is ETF, CFD and  SPAC. Another parallel is junk real estate/junk mortgages and cryptos.

Each item/rhyme comes with its own set of problems:

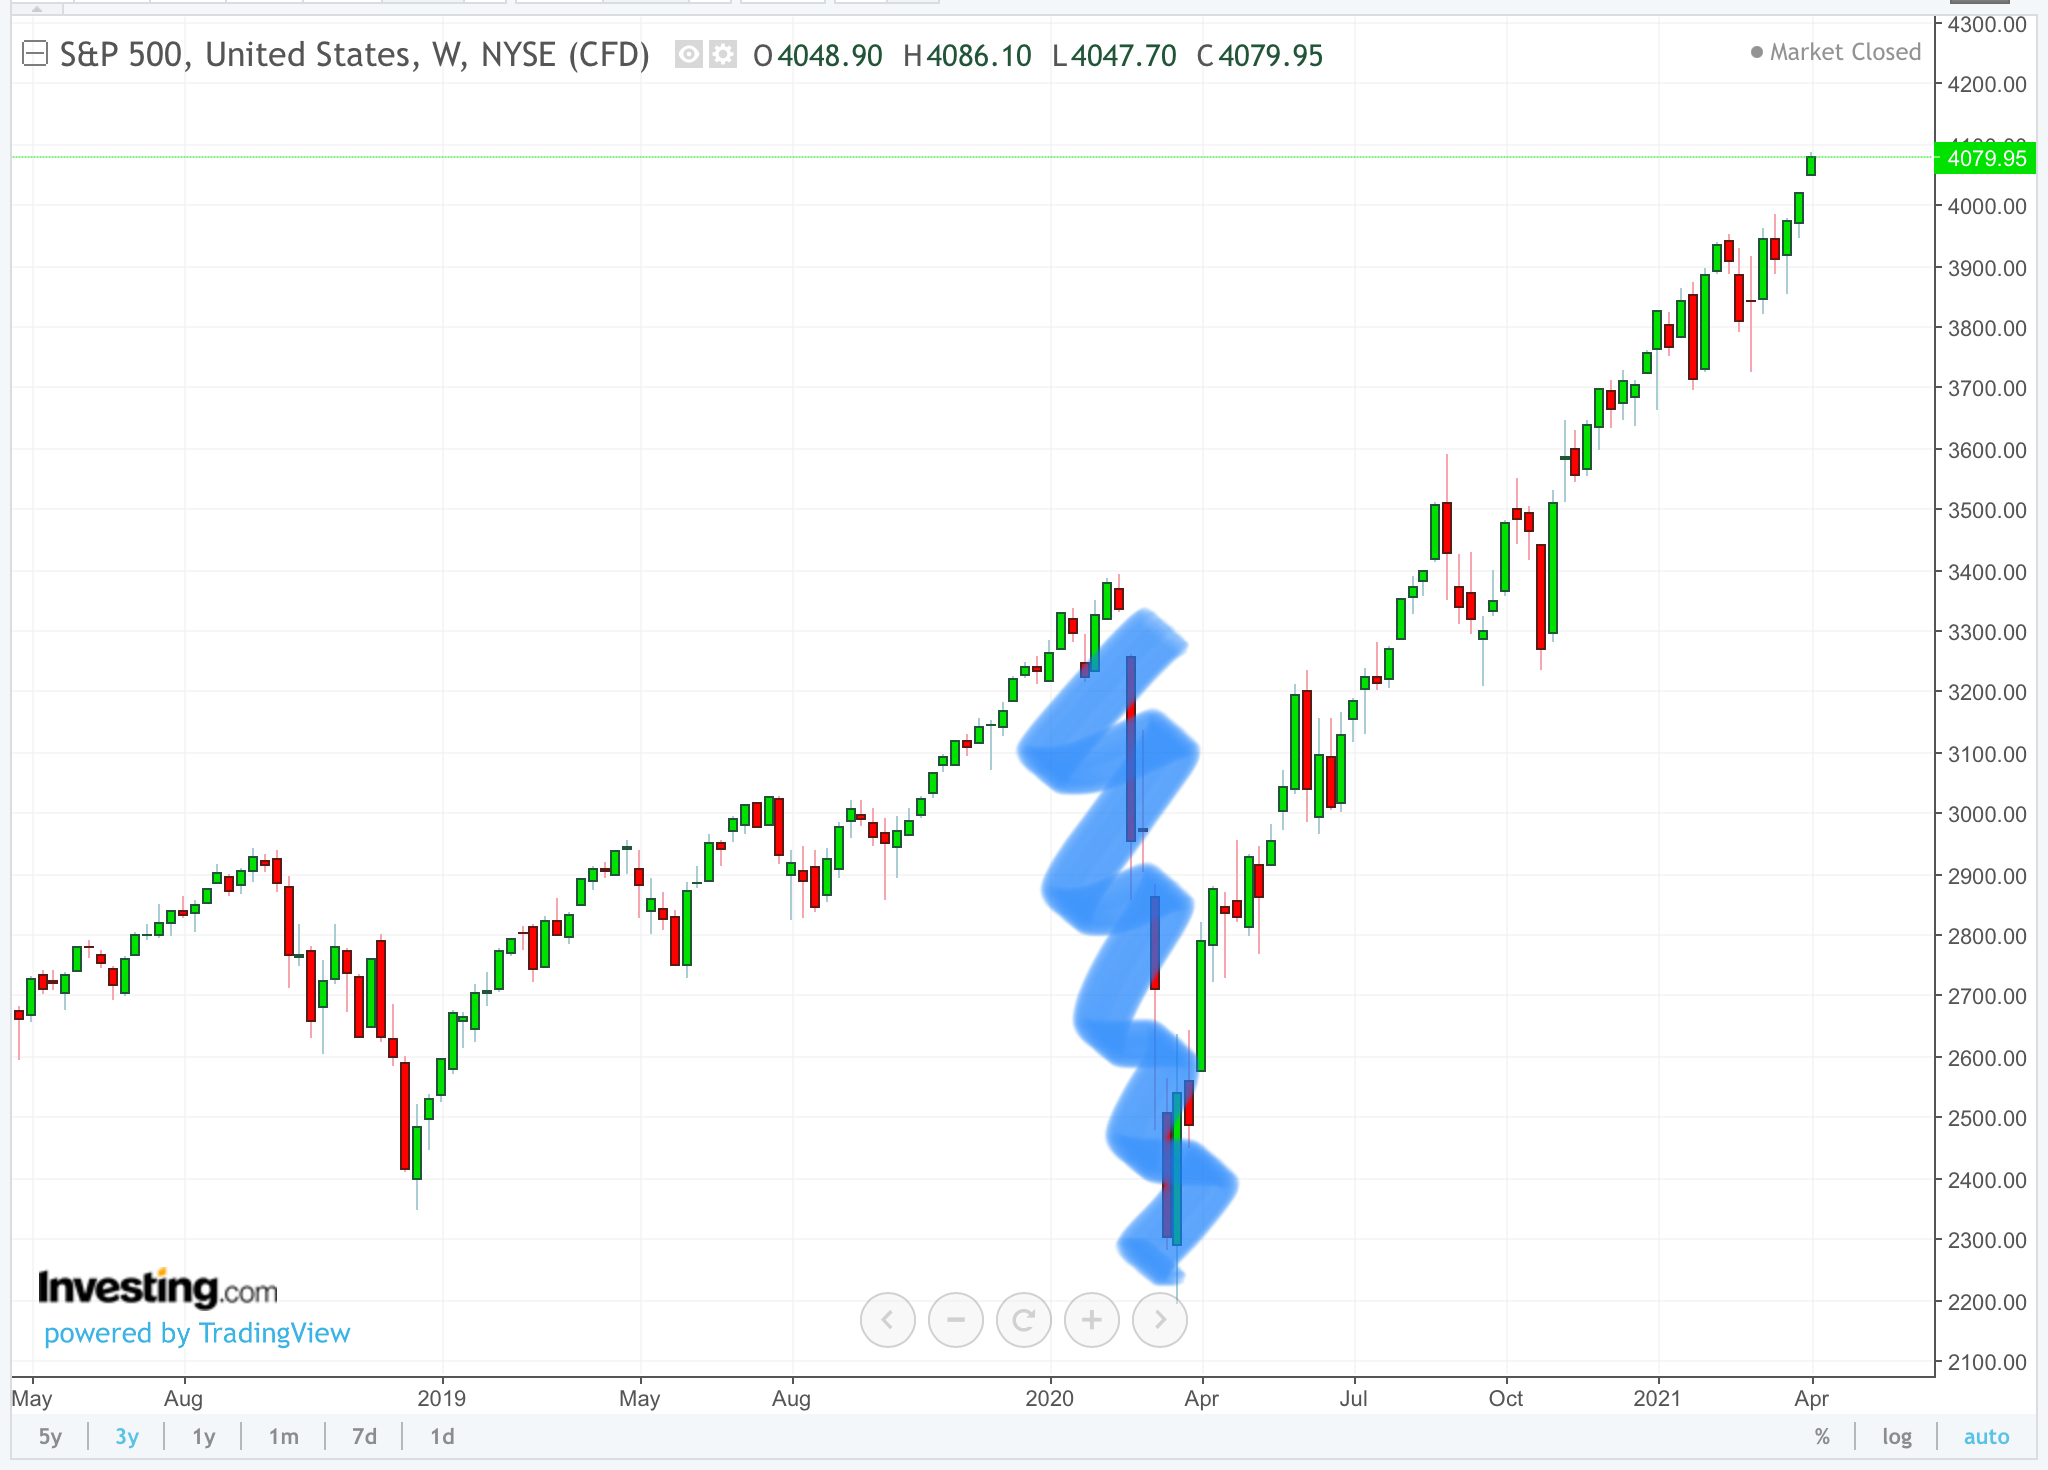
  • Exchange Traded Funds are now so prevalent that they edge out most of the discretionary, alpha type investors. They are a sort of a fire-and-forget missile which lulls investors into an unthinking nirvana state where sound economic analysis goes out the window. Index trackers, in particular, are highly problematic;  for example, S&P 500 is capitalization weighted, so its performance can become ever narrower as valuations of fewer companies soar to ridiculous levels. (Tesla, really?).  Many tracker ETFs are also highly leveraged to achieve their stated 2-3X performance goals.
  • Contracts For Difference are custom-made derivatives that give a speculator the upside/downside gain/loss without purchasing the underlying security.  It is exactly what bucketshops dealt in back in the early 20th century.  Today’s CFDs are also incredibly leveraged since they provide 20x or even 50x exposure. They are behind the Archegos collapse which resulted in a $20 billion instantaneous wipeout and losses estimated at over $6 billion for several investment banks.
  • Special Purpose Acquisition Companies are the ultimate sucker bet: give me your money now,  I won’t tell you what it will be invested in, but I will charge enormous fees upfront, as much as 20-25%.  That’s exactly like London’s South Seas Bubble, to use another historical rhyme. Their popularity until very recently was eye-popping, with even pop culture icons lending their name to such questionable ventures.
  • Last - but certainly not least - are cryptos, the hoi polloi’s get rich quick dream.  Back in 2005-07 even strippers got into the junk real estate game, hoping to make a fast buck. They were enabled by no-money-down sub-prime mortgages and a whole network of brokers, lenders, packagers, bankers, rate agencies and insurers. Likewise, today’s foam at the mouth crypto speculators are enabled  by app-only brokers, specialty exchanges that operate 24/7/365, pithy “analysts” that predict the demise of national currencies, and even mainstream investment banks who are watching the billions go by and are itching to grab their piece.  Carnival barkers (nice doggy, literally) also abound.
Ok, that’s it for the second stanza - except one more observation: the Archegos disaster is already acting as a catalyst for leverage caution, just like the very first problems with mortgage originators and lenders caused concern back in early 2007. 

In the next stanza I will look at the more intangible rhymes, those that deal with anecdotal evidence such as 12 year old speculators, tokens, virtual art, NFTs, and their historical counterparts.


Sunday, April 18, 2021

History Rhymes, The First Stanza

 Students of history know that it may not repeat per se but it very definitely rhymes. As Ecclesiastes said 2500 years ago, there is nothing new under the Sun. Let’s take a look back..

The Great Debt Crisis of 2007-09 was precipitated by a wanton disregard for credit risk, particularly in the real estate sector.  Trashy, subprime mortgages were packaged into tranched CMOs sporting ratings as high as AAA and sold to investors.  Mortgage and other loan originators were paid to lend as much money as possible, not to assess the borrowers risk.  They had every incentive to do so, since investment banks were hungry for fee-producing “product”.  Ditto for rating agencies, who charged mightily to provide algorithm-generated ratings, instead of doing solid credit analysis. Furthermore, an enormous side business in credit derivatives such as CDS and CDOs generated even more fees and profits.

The enabling mechanism was that those most responsible for the bubble - originators, mortgage and real estate brokers, loan packagers, investment banks, credit insurers and traders - did not keep any of the credit and market  risk themselves, since they were just fee-creator middlemen who passed the risk on to investors.  In other words, a kind of pyramid scheme.

When the pyramid collapsed, some where caught with too much “raw product” in their “warehouses” (eg Countrywide), others with too much “finished product” for sale on their “shelves” (eg Bear Sterns, Lehman, Merrill) and a few others had taken on too much insurance exposure (eg AIG).  They all failed, merged, or were bailed out using taxpayer money.

At the buyers’ end, banks, mutual/money market funds and pension funds were stuck with paper that was for all purposes worthless and they, too, mostly had to be bailed out by governments. Again, taxpayer money.

As always, there were those few “wise guys” who profited mightily from the bubble’s demise. I don’t need to tell you who they were, they even made movies about them. And, pointedly, they are still around and many are bigger than ever. 

The cost of the mess is still with us in the form of zero/negative interest rates, a very weak banking system  and a global economy beholden to cheap Asian imports purchased using vendor finance (eg Chinese and Japanese government bond purchases).

So much for the past then, or, in poetic terms, the first stanza. The rhyme will come in my next post, the second stanza...

Stay tuned.


Friday, April 16, 2021

Friday’s Fed Funnies

 The role of the Fed, so goes the saying, is to take away the punch bowl when the party gets out of control.  

Not Today’s Fed

However, today’s Fed is the exact opposite - it insists that the bowl is there to stay until everyone and everything is smashed, literally.  Because the Fed and the Treasury are forcing everyone from banks, pension, hedge and private equity funds, all the way to froth-in-the mouth individual speculators to accept as much risk as possible in order to achieve small and rapidly diminishing returns.  The yield spread between junk and Treasury bonds just hit an all time low yesterday at just 2.59% - chart below.  

Imagine that: an income-oriented investor is now forced to accept a very significant risk of losing all of his money to default to make a measly 2.59% more than the safest AAA Treasury. Given that the historical average default rate for high yield bonds is 4.5-5.0%, how rational is that?  


Yield Spread Between Junk And Treasury Bonds Hits All Time Low

And that, among many other signs of excess, may soon lead to a rather unpleasant future, as the next cartoon “predicts” 😂 Have a great weekend 


Wednesday, April 14, 2021

Mind The Gap... Tomorrow

 For over 30 years - closer to 40, actually - the yield on 10 year Treasury bonds easily exceeded inflation, making US government bonds an attractive investment for conservative investors like pension and sovereign retirement funds. The benefits to the United States were obvious: the dollar maintained its preeminent position as reserve currency. 

But, no more:  as we see from the chart below annualized CPI inflation (blue bars) is running way above Treasury yields (red bars) - that’s where the arrow is pointing. If you can’t see the red bars in the last part of the chart,  it’s not a mistake: yields are way too low to show up. It’s the largest and longest “gap” since the 1980s, and back then it was a healthy reaction/expectation that inflation would cool fast because of the very restrictive monetary policy.

The reason is, of course, the current Fed/Treasury unholy alliance which has the central bank following the loosest monetary policy in history.  Printing furiously, keeping short rates at 0% AND buying $120 billion bonds per month.  It’s all about the Modern Monetary Theory, which goes like this: it doesn’t matter how much and how fast we print money because in the future the economy will expand even faster and will absorb the money without causing inflation. A strategy also known as wishful thinking...

Putting it in medical terms, it doesn’t matter how much you smoke, drink and eat now because down the road you will do what is necessary to be healthy. 

Hmmmm... Like Annie would say: Tomorrow... tomorrow...


Monday, April 12, 2021

More Than A Dozen

 According to data from Bank of America presented in a Bloomberg article, since last November equities have seen inflows of an astonishing $575 billion, more than in the last 12 YEARS combined.  Goes a long way in explaining the meteoric rise in stock prices.

Meanwhile, the same article points out that as prices rose trading volume has been coming down - see  chart below.

8

The saying goes “volume leads prices”, so... fair warning, I guess.


Thursday, April 8, 2021

Feeling Lucky?

 The US stock market is making new all time highs after bottoming out on March 23, 2020, when S&P 500 reached a low of 2200. The gain since then has been a whopping 86% in just over 12 months.  How rare is that?  In a word, extremely.  Looking at the frequency distribution of rolling 12 month returns, such an event has occurred just about.... never!

Ok, but it’s a few days more than 12 months you say, and you are right.  Looking at exactly 12 months since April 8, 2020 the return is “only” 49%, an occurrence with a frequency of a bit under 1% of the time. That’s once every 100+ years.  (A bit like pandemics, eh?)


Let’s go ever further out on our assumption Matrix (pun intended) and say that last year’s big drop never happened, and pick up things from the previous high of 3370, pushing it forward to April 8, 2020.  This will produce a 12 month gain of 21%, an event with a frequency of 13%, ie one out of every 8 years.

Of course, you can’t just take a big blue marker and wipe out the pandemic from history.  Neither is an 86% gain a truly relevant statistic, since it happened from a deep, panic induced low.  For my money, the frequency band that makes sense is between less than 1% and 13%.  It’s like saying that today’s market is a lottery ticket with the odds of not losing being somewhere between 1% and 13%.

Ahhh, but that’s not why you buy a lottery ticket - you want to win!  So, starting today you want to look at the next 12 months. Let’s  say you will be satisfied with the median annual return of 8.79%.  That will mean that the 24 month rolling gain will be 57.79% (49+8.79) - call it 58% for short. What are the odds of THAT?  

Looking at the table below, the average 2 year return is 18%, far below your target of 58%.  How far? I don’t have the raw data, but I’m willing to bet it’s a 3+ sigma event.  

So, if you’re feeling lucky, and I mean REALLY lucky, by all means take the plunge... 😁😁


Tuesday, April 6, 2021

Payroll Numbers

 The US economy added 916.000 jobs last month.  Here’s a breakdown by industry and average hourly wages.  Once again, most gains by far came from low pay jobs in leisure and hospitality. Anecdotal evidence points to restaurants and bars in such places as Florida doing all time record business. Easy come, easy go... but, for how long?