Friday, May 30, 2008

And What Are We Going To Wrap Fish With?

Circulation of American newspapers has been on the decline for nearly 20 years. Consolidation of major city newspapers took its toll back in the 1980's and the internet is now accelerating the process (see charts below, 2006 latest data).

Data: Newspaper Assn. of America

The number of daily newspapers has been declining continuously since 1980.

It's unlikely that health obsessed Americans would ever eat fish 'n chips wrapped in yesterday's newsprint soaked in vinegar, but don't news-papers have certain qualities that transcend the electronic media? Reading at the beach comes immediately to mind, but there are surely others - aren't there?

And what does all this have to do with debt, credit and markets? Nothing, except for this: the summer has officially started and I am off to the beach, where I plan to read a few research reports. Printed on paper, of course!

Have a nice weekend.

Thursday, May 29, 2008

The Bernanke Put: What Next?

The Fed has so far used up almost half of its balance sheet in its bailout efforts (see chart below, click to enlarge). It has accepted all manner of securities backed by mortgages, credit card receivables and auto loans in exchange for its own US Treasurys. The Fed's holdings of Treasurys have declined from 92% of assets last May, to 57% this year*.

In essence, the Fed provided - gratis, I might add - a put option which was immediately exercised by commercial and investment banks in dire straights. What will undoubtedly become known as the Bernanke put, is currently turning schlock into lucre by the bucketful. Who said the philosopher's stone doesn't exist, eh?

Data: FRB

The Fed's unprecedented actions arrested what was shaping up as a major shake-out of the shadow banking system - but at what cost?

The immediate result is that Federal Reserve Notes (i.e. US Dollars) are now backed to a very large extent by entirely price- and quality- opaque assets, issued by private banks, brokers and special purpose securitization entities. This is certainly no small matter, but not my main concern right now.

More serious, in my opinion, is the possible effect on market psychology if there is another incident similar to Bear Stearns. This is becoming increasingly likely because the real estate market continues to weaken and consumer sentiment and behaviour remain negative. (For example, Nouriel Roubini thinks that Bank of America is now unlikely to take over Countrywide.)

In such an event, market participants will immediately think as follows:
  1. Damn! Whatever the Fed did, didn't really work. Here we go again.
  2. Look! They have much less wiggle room in their balance sheet.
  3. So! What are they going to do now? What can they do?
At that point every investor, trader and speculator will have to make up his/her own mind how to act. Given the reduced means of the Fed's balance sheet, the chances of "shoot first, ask later" are high and this means a whole lot of pain for markets.

In other words, the extensive exercise of the Bernanke put has increased the likely damage from a second round of financial turbulence.
_____________________________________________
* Gold, SDRs and other incidental assets have been omitted for clarity - they amount to less than $20 billion, anyway.

Wednesday, May 28, 2008

A Progression of Curves

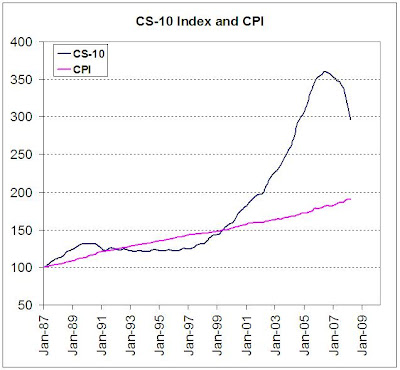
Prompted by yesterday's release of the S&P - Case/Shiller home price index, here is a progression of curves. All have been indexed so that 1/1/1987 = 100.

First, the index itself.

Data: S&P

Now, let's see how home prices have fared versus inflation (CPI).

Data: S&P, St. Louis Fed

OK, that was pretty interesting. Now, how about adding per capita disposable personal income? This should give us an idea about housing affordability.

Data: S&P, St. Louis Fed


Hmm... we obviously got a ways to go before balance is restored. And with markets always prone to excess, it's quite possible that prices will undershoot.

OK, let's now add one more curve, the crucial catalyst that made this "reaction" go as fast as it did: per capita household debt.

Data: S&P, St. Louis Fed

Any questions?

Well, I have one: judging from the above, is the credit crisis over?

Monday, May 26, 2008

In Memoriam: The Age of Complacency

Today, a Memorial Day special.


When supply and demand become unbalanced in a free market, prices act to bring them back into line. But if physical supply is constrained for some reason (e.g. depletion, war or embargo) prices have to rise a lot further before balance is restored. That's because in the absence of
additional supply, the only alternative is to lower demand via higher prices, i.e. prices have to do double duty. This is more so for goods that exhibit relatively inelastic demand, like crude oil.

Today, the relentless drive of crude oil to over $130 per barrel spells the end of The Age of Complacency, a quarter century during which we were lulled into smugness about the price and availability of necessities like food, energy and clean water.

Data: FRB St. Louis

For 25 years we literally sleepwalked. And finally smacked head-on to the most virulent supply-demand imbalance this world has ever seen. The sevenfold increase in prices serves as a rude wake-up call: we once again have to worry about the things we need, as opposed to the things we want.

We need food. So to keep the Green Revolution going we apply massive amounts of fertilizer, pesticides and mechanization to the production of grains and meat. Fertilizer consumption in the US, particularly nitrogen in the form of ammonia produced from natural gas, has increased sixfold.

Chart: USDA

And just like oil, fertilizer prices have now spiked sixfold. Yes, we really do eat oil and natural gas.


Data: YARA

During the Age of Complacency we thought good times would last forever, so we borrowed up to our eyeballs and kept satisfying our hankering for all things consumer. Household debt doubled as a percentage of disposable income, accelerating sharply in the last seven years. Instant gratification became the norm, instead of the exception. Well, goodbye to all that.

Data: FRB

At the end of the Age of Complacency, we find ourselves at a crossroads.

We can choose to live in denial for a short while longer. But soon thereafter we will have to pay dearly. Socio-economic triage will become a necessity, involving famine, pestilence, riot and war. The other five billion souls inhabiting this planet are simply no longer content to subsist on two bowls of rice per day, so that we can drive to the mall and fly to Monte Carlo for the races. The information revolution has seen to that, blogs included.

There is another choice: Change, starting right now. Reduce our consumption of everything, establish an alternative economic model based on sustainability, view growth as an opportunity instead of a purpose. Radical? Of course not: it's simply necessary.

How can we accomplish change? Necessity being the mother of all invention, there are many suggestions running the gamut from disguised denialism (corn ethanol), to hopeless futurism (power stations in space). Some are even downright macabre (dieoff). My own is the Greenback, a straightforward suggestion that involves familiar instruments and institutions in a novel application. There are no perfect solutions, of course; but doing nothing is much worse.

How are we currently doing at the crossroads, then? Not very well, I'm afraid. Denial is still the order of the day: we are told that the American way of life is non-negotiable, that tax cuts and shopping will boost the economy, that more drilling in the most hostile environments will (briefly) quench our thirst for fuel. In finance, we opt for bailouts instead of practical workouts, hoping the rest of the debt won't come crashing down from its rickety pile. Our political and economic leadership is, sadly, behind the times.

So, it is really up to the rest of us to quit being complacent and change our ways. There is no need to list what each of us could and should do - we already know. There are no excuses. Let's get involved in our future.

Friday, May 23, 2008

CPI , PPI and Profits

Disregarding how government statistics are calculated, producer prices have recently been rising significantly faster than consumer prices. We can observe this in the chart below that tracks the PPI and CPI indices (click to enlarge).

Data: St. Louis Fed

A clearer picture emerges when we plot the ratio of PPI to CPI - see the chart below.


What does this divergence mean - assuming that statistics are honest, or at least equally biased?

In my opinion, the divergence - if it lasts - is a precursor of a structural negative shift in corporate profitability, i.e. lower profit margins for finished goods. Interestingly, retail prices started rising faster than producer costs back in the early 1980's, just as the bull market in stocks got going. The two events are related on a fundamental level, since stock prices are clearly a function of profitability.

The widening process continued unabated until 2003 when it reversed. And in the last 18 months it appears that companies are losing pricing power even faster. All other things equal, this sequence should impact profits and share prices on a fundamental basis.

Thursday, May 22, 2008

No More Salami

The CDO Era is over. According to SIFMA, global CDO issuance in the first quarter of 2008 came to a mere $11.7 billion, down 94% from the same time last year.

(Note: The y-axis legend should read $ Billion) Data: SIFMA

While the sudden death of structured finance may go unlamented by most, you can be certain it will be sorely missed by the hundreds of thousands of newly bereaved bankers and brokers who depended on it.

The making of salami out of hoggish assets involved serious money. During 2006 and 2007 a combined $1 trillion of new CDOs were issued globally, generating tens of billions in underwriting fees alone. When everything else is added up, from sales commissions and secondary trading to the creation of piggy-back products like CDS and SIVs, the total revenue was many times over. Compare this with equity IPOs, which raised a total of $712 billion in 2006-07 (World Federation of Exchanges data).

Clearly, structured finance was the most profitable product coming out of the great salami factories in Wall Street and the City. With the production lines now idle, there are no more financial sandwiches made; and thus, no need for bread, tomatoes, or condiments - and no need for all those deli counter employees, either.

So, what's next on the menu? After all, the financial industry is nothing if not quick in manufacturing new products out of the same pig. I believe this time it will take longer, however. We have killed too many piglets to make salami and the next litter is not yet on the horizon. The sow is not even trying her new lipstick on...

Wednesday, May 21, 2008

My Dog Ate It

Latest excuse for the credit snafu: it's the computer's fault.

Moody's is conducting a review to see how come several CPDOs (constant proportion debt obligations), some of the most highly engineered products in the alphabet soup of finance, were given AAA ratings when they should have been as much as four notches lower.

I note that CPDOs are some of the most virulent forms of credit derivatives ever devised. In short, they force investors to keep raising their ante in the form of higher leverage as losses mount. It's equivalent to doubling down every time you lose a round at the roulette table. Most appropriate rating for CPDOs? "F", as in: "fools and their money are soon parted".

Naturally, such claims of involuntary computer malfeasance can produce other schoolboy excuses. For example, MBS arrangers who never bothered to obtain proper title ownership paperwork, can go before the foreclosure judge and claim "my dog ate them".

Tuesday, May 20, 2008

(Bor) row, (Bor) row Your Boat...

Always in search for the real data on the US economy (e.g. food stamps, crime tips for cash), I found this one in the NY Times: recreational boat repos are surging.

Mr. Henderson has been a boat repo man for 20 years and has never been busier than right now. “I used to take the weak ones,” he said. “Now I’m taking the whole herd.” He is repossessing a boat a day.

Just like with houses, many boat owners are finding themselves "upside-down" on their boat loans. With fuel costs soaring, used boat prices are tumbling as fewer and fewer can afford a spin in the water. To make things worse, typical loan amortization schedules result in little principal being paid off in the first years.

A Beautiful Piece of Collateral As It Attempts To Flee The Repo Man

Like I've always said, the best boat is your buddy's boat. Next best is the one you rent by the day or week. And third best is the one you buy at the repo man's sale.

Monday, May 19, 2008

Oil Prices: Observations of A Daily Biker

Everyone by now is wondering what is going on with oil prices. Cheaper dollar, nasty futures speculators, conspiring oil producers... yup, they are all true to a certain extent. But... how about the simplest explanation of them all: there's still way too much demand, particularly in developed countries.

I bicycle at least 10 miles everyday, sometimes more depending on my schedule. My timing (rush hour) and route (next to a major commuter avenue) allows me to observe this very simple fact: 95% of the cars on the road carry one single person, the driver. And there are a lot of them, usually gridlocked. Meanwhile, the buses and the trams that go along the same route are never more than half full. (Just to be clear, I do not live in Venezuela where gas prices are 12 cents per gallon.)

Data: BP, Nationmaster

What this simple observation tells me is this: while everyone may grumble about gas prices, they are still going on with their lives as if nothing has changed. All talk, no action. There are some serious attitude adjustments still ahead for all of us because China, at the very least, is on a one way street to westernisation.

At least that's the view from The Daily Biker.

Sunday, May 18, 2008

The Tipster Index

Forget the namby-pamby seasonally adjusted and massaged official data about the US economy. Here's the real deal: the tipster index.

Crime Stopper agencies across the US are reporting a sharp rise in tips for reward money, with calls rising by 25%-45% from last year. Tipsters are saying they need the money for food, gas and utility bills. “For this year, everyone that’s called has pretty much been just looking for money,” said Sgt. Lawrence Beller, who answers Crime Stoppers calls at the Sussex County, N.J., sheriff’s office. He said the average payment for a tip that results in an arrest is $400. Rewards across the nation vary from $50 to $1,000.

Sergeant Johnson of Jackson, Tennessee has been a Crime Stoppers coordinator for 15 years, watching crime rates and tips fluctuate. He said, “I’ve never seen an increase like it is now.” Some people are making a regular living out of crime tipping, earning up to $750 per week with repeated calls. The Crime Stopper agencies even advertise their version of the "service economy":

“Crime doesn’t pay but we do,” say the mobile billboards cruising Jacksonville, Fla. A poster in Jackson, Tenn., draws a neat equation: “Ring Ring + Bling Bling = Cha-Ching.” The bling, in this case, is a pair of handcuffs.

Cha-Ching? Cha-Ching? What's next? Children squealing on their parents to buy the latest version of Grand Theft Auto?
____________________

This reminds me of the excellent movie The Lives of Others. It won the best foreign film Oscar in 2006. If you haven't seen it, don't miss it..

Friday, May 16, 2008

Energy, GDP and Debt

I'll throw up this chart without too much comment. It tracks total energy consumption, real GDP and real total debt in the US (real = adjusted for CPI inflation).

Data: BP, FRB

The divergence between GDP and energy consumption started back in 1980 and could be explained - for a while, anyway - by efficiency and conservation gains. But from 2000 to 2006 energy consumption suggests a real US economy that has gone flat: total energy use in 2006 was virtually unchanged from 2000, while real GDP was reported as rising +15%. Cheap imports?

And surely the 42% increase in real debt since 2000 had something to do with it?

I'll leave it at that, so you can all reach your own conclusions. Have a very pleasant weekend.

_________________________________

I realized that today marks exactly one year since I started tracking how many people visit Sudden Debt. In that one year there have been 375,000 unique visits and 495,000 page loads - and they started from a daily count of almost zero. Many thanks to all who come here - I hope you find the experience worthwhile. And since I can't really do without charts...


Wednesday, May 14, 2008

All The Money In The World

A friend of mine with many decades in the finance business has a saying: "If this goes on much longer they will end up with all the money in the world". He uses it to point out various cases of extreme pricing and market power, which sometimes (but not always) evolves to become a bubble. Prima facie evidence suggests that in today's environment his saying readily applies to crude oil.

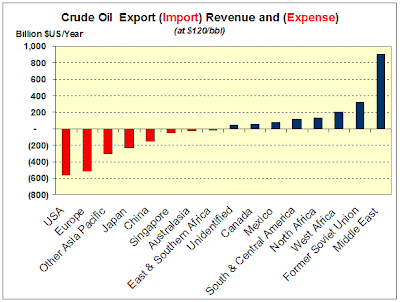
Look at the chart below: at $120 per barrel, revenue from exporting crude oil and its products comes to over $1.85 trillion per year. The Middle East alone gets nearly a trillion and the former Soviet Union $300 billion - and that's before including natural gas.

Export-Import Data: BP (2006)

At current oil prices, this is by far the largest capital recycling and concentration pump in the entire history of the world. A dollar may not buy as much as it used to, but a trillion every year still buys plenty, even after liberal handouts pour epater les bourgeois. Very plenty, in fact: US and European banks, other resource companies like ore and coal miners, shipping and port operators, electricity, water and telecom providers and a host of other essential businesses. That's where all the SWF and private oil money is going, most commonly channelled through secretive private equity funds.

Obviously, the oil exporters are furiously planning for their post-Peak Oil future: sensibly, they don't want to ride camels again. And if this goes on much longer, by the time their oil wells start to decline they will own everything that matters and will be sitting - literally - atop all the money in the world.

What are the rest of us - Americans and Europeans alike - doing to plan our post-peak future? Next to nothing, is the painful answer. If a few EU nations like Germany, Denmark and Spain are attempting to face the alternative energy challenge, the US as the largest oil consumer is making a momentous mistake by its absence. Stubborn reliance on imported oil is rapidly impoverishing the nation. That sucking sound we all hear in our pockets is money vacuumed out by the oil exporters, only to come back as foreign equity ownership of everything.

The American administration is repeating the glaring mistake of the French and German armies' Russian invasion, albeit in a different context. Like arrogant generals whose prior easy victories made them blind to current harsh realities, Bush & Co. are throwing away America's post-Cold War advantage into the maws of the giant oil recirculation pump. Like Napoleon and Hitler before him, George W. Bush has failed to provide the nation with the protection of a sensible energy plan.

To make matters worse, the current monetary policy is designed solely as a bail out of a bankrupt shadow financial system. By preventing the liquidation of excessive debt that could result in a more efficient and sustainable economy, it keeps the dollar/oil recirculating pump going at full speed.

America is in the unfortunate position of being at the hands of a dogmatic incompetent and a near-sighted academic. For different reasons, both blithely believe they are right beyond doubt. One because he converses with God and the other because he trusts his econometric models with religious fervor.

But if they are wrong the price of failure is the end of Empire. That's too much to bet, by a long shot.

________________________________________

...and here's a perfect example of the lunacy perpetrated in order to keep the game going at all costs. CPI inflation was just reported as 0.2% for April, largely because the BLS said that gasoline prices DROPPED 2.0%. Yes, that's what the BLS said: gasoline prices dropped two percent in April. Now, we all know that prices climbed 9.5% during April, from $3.29/gal to $3.60. This was reported by no less than the government's own Energy Information Administration.

Ahhh, but such hard facts are immaterial to the BLS. You see, according to their seasonal CPI model, gasoline prices should have increased even more in April so a sharp rise ends up reported as a decline. I would try this argument next time I show up at the pump for a fill up, but I have a hunch I'd end up with a black eye.

Tuesday, May 13, 2008

Food Stamps and The Un-Adjusted Economy

The number of Americans on food stamps just hit an all-time high. During January and February 2008 (latest data available) an average of 27,675,000 Americans participated in the program, 1.4 million more than at the same time last year (see chart below, click to enlarge).

Data: USDA

What is troubling is that the number rose and remained high, though six years passed since the official end of the last recession. It is now rising again as the economy weakens. The comparison with the 1991-92 recession and subsequent expansion is quite disturbing.

While food stamps are clearly a lagging economic indicator, the continuous rise in recipient numbers during 2002-2008 causes me to conclude that real GDP growth in previous years was not as robust or widespread as the headline numbers suggested. Unlike other data, I believe food stamp numbers are not greatly "adjusted" and thus provide a truer picture of the economy - or, at least one aspect of it: how difficult it is for real people to make ends meet. As opposed, say, to those phantom employees created by BLS models. (I guess they don't need food stamps because, if we are to believe the official inflation figures, they don't eat.)

For example, after adjusting and re-adjusting, the BLS reported that the economy added a net 800,000 jobs in the 12 months to February 2008. And yet, in the same time food stamp participation increased by nearly double that number. While the two statistics are not necessarily mutually exclusive, which one provides a better "feel" for what is actually happening in the "un-adjusted" economy?

Looking at the entire 2002-07 period, the economy added a net 8 million jobs and 10 million more people went on food stamps.

____________________________________________

Retail and food service sales were reported today (-0.2% from the previous month) and the media spin machine immediately went into overdrive to cushion the bad numbers. The favorite ploy is to exclude autos and various other sectors to come up with "core" retail sales. (It's a bit like core inflation that excludes food and fuel, also known as inflation without the inflation...).

Today's spinning involved the exclusion of auto sales, since they dropped by a very sharp -2.8% in April. So, without the drag of such a terrible figure, "spun sales" become a much more palatable +0.5%, supposedly signifying all kinds of "robust core spending" nonsense. Only problem is, at $72 billion/month auto sales are by far the largest segment, accounting for 20% of all retail and food service sales.

Since two can play at this game, how about total sales minus gasoline, food stores and restaurants? After all, these are exactly the items most impacted by rising food and fuel prices and rising sales there are not exactly a sign of higher discretionary spending. This total was down -0.4% from March.

Robust..not!

Monday, May 12, 2008

Glaringly Wrong, Or ..?

The post's title refers to an article in the January/February 2000 issue of Foreign Affairs about the price of oil.

But before delving into that, a current Reuters news story about GE Money ceasing to finance motor homes and recreational boats. Sales of such pricey toys have collapsed: year-to-date motorhome shipments are down 24% and sales at the nation's largest boat retailer are down 28% in the first quarter. Along with Starbucks overpriced lattes, these are additional signs that the US consumer is hitting the brakes hard.

And while peripheral, highly discretionary items are feeling the impact hardest, overall spending is down significantly, too. According to SpendingPulse, retail sales excluding gasoline and autos were down 0.7% in April versus March.


OK, back to the Foreign Affairs article from 2000. You can read a 500 page preview here (or the entire article if you are a subscriber).

This is a part of the first paragraph:

But contrary to much received wisdom, the energy problem looming in the early 21st century is neither skyrocketing prices nor shortages that herald the beginning of the end of the oil age. Instead, the danger is precisely the opposite; long-term trends point to a prolonged oil surplus and low oil prices over the next two decades [emphasis added].

The writers predicted oil would remain in the $12-20 range for another 20 years.

Instead, we got this:

The purpose of this post is not to scoff at a glaringly wrong prognosis by two experts - anyone can make a mistake. Indeed, it is sometimes far easier for "experts" to make mistakes than rank novices (ever heard of beginners' luck?). Instead, this post is about a different interpretation of the what, why and when of the article, one that may also shed some light at current oil prices.

First, some background: by 1998-2000 oil prices were scraping the teens and low twenties for over a decade. The national economies of crucial Arab allies like Saudi Arabia, plus Russia (a.k.a. "Upper Volta with nukes") were essentially bankrupt. Populations in Arab oil producing nations exploded upwards while oil income collapsed, threatening the socio-political stability of the authoritarian regimes. Massive subsidies for everything from food, fuel and higher education, medical care and even wedding dowries were no longer possible. Agitation by young, restless populations was on the rise...

I remember reading the article when it first came out. My first reaction was surprise at the truly parlous state of finances in the Gulf region. In Saudi Arabia alone, real GDP per capita had slumped from $11,450 in 1984 to $6,750 in 1994. The country's budget had swung from $140 billion in surplus revenue in 1982 to consecutive deficits that eventually ran up a national debt of $130 billion. Other oil producers - most obviously Russia - were in even worse shape.

My second thought, then, was that "they" wanted oil prices to go higher in order to prevent major geopolitical upheaval ("they" being the loose term employed when referring to the US establishment, for which Foreign Affairs is the recognized house organ). The article's purpose, therefore, was not to predict low oil prices but to warn that low prices were dangerous and no longer desirable. Indeed, after a brief pause due to the shallow recession following the dotcom bubble, prices climbed inexorably higher.

Well, things have now come full circle. The latest issue of Foreign Affairs carries an article ("Blood Barrels") that is in the exact opposite direction of the one that appeared eight years and $100 ago. The summary reads:

Oil wealth often wreaks havoc on a country's economy and politics, helps fund insurgents, and aggravates ethnic grievances.

From cursing very low oil prices in 2000, "they" have now gone to "..the so-called oil curse", "Dutch disease" and armed conflict by internal insurgencies. In the 3,000 word article "conflict" appears 17 times, "war" 11 times, insurgent/insurgency 7 times and violent/-ence 4 times. Get the message?

Now, all of the above is not meant as my prediction that oil prices will move lower - I am just pointing out the ebb and flow of the establishment's views on the subject. In any case, readers know that I prefer pricing energy on a like-for-like basis (EROEI), instead of artificial dollar terms that can expand or contract with monetary policy.

One final observation.

President Bush is to visit Israel, Saudi Arabia and Egypt between Wednesday, May 14 and Sunday, May 18. This is the schedule:

Wednesday - Israel
Thursday - Israel
Friday (until abt. noon) - Israel
Rest of Friday - Saudi Arabia
Saturday - Egypt
Sunday - Egypt

If you are familiar with diplomatic protocol you can immediately "read between the lines". A visit to Saudi Arabia lasting just a few hours scrunched between Israel and Egypt is the equivalent of expressing severe displeasure, i.e. the White House is flipping Saudis the finger (or is it the other way around?). The cause for such displeasure is easy to guess: despite repeated US entreaties to raise oil production and lower prices, the Saudis are staying put. They blame record prices on the lower dollar, speculative frenzy in futures markets and high demand from Asia, but the US administration is clearly not satisfied.

There are more aspects to this story, most prominently the possibility that Saudi oil production has peaked (see Simmon's Twilight In The Desert). But "they" are very far from acknowledging any such possibility, at least publicly, choosing instead to view high oil prices as a deliberate choice by Arabs bent on maximizing current gain and "buying up the world" through sovereign wealth funds.

My view is that we will find out very, very soon what is really going on.

Friday, May 9, 2008

Data To Die For

How can we realistically trust the data that come out of the various US departments anymore? Even given the benefit of the doubt, i.e. assuming model massage was originally established to provide a clearer picture of the US economy, the ultimate result now looks more like an elaborate GIGO * contraption designed by Rube Goldberg.

Case in point: the Net Birth/Death model of the Bureau of Labor Statistics. During the most severe downturn in the real estate and homebuilding sector since the Great Depression, the model keeps creating phantom construction jobs (see chart below, click to enlarge).


Not only did the model spew out a total of 98,000 net additional construction jobs in the 12 months to April 2008, it produced more such jobs in April 2008 than the same month last year (45,000 vs. 37,000, or +21%). In other words, new construction businesses that were established in that period supposedly created many more jobs than those lost from businesses shutting down.

The first casualty of war is the truth - Aeschylus. Problem is, who's the enemy?


_____________________
*Garbage in, garbage out

Thursday, May 8, 2008

Slow Crunch Time

No wonder consumer confidence is in such a sorry state.

Americans are now forced to spend a large and rising portion of their disposable income on necessities: food, fuel and debt service. Such expenses now require 31.5% of disposable personal income (DPI), the most in 25 years. While outside factors may also affect consumer sentiment (red line), it closely tracks spending on necessities (blue line). As prices for such items rise faster than income, less money is left over for everything else and confidence drops.

Both measures are now back to levels last seen in 1982-83 (click to enlarge).

Unless retail prices for necessities soon reverse dramatically (unlikely), or incomes rise faster than food and fuel inflation (even more unlikely), consumers will stay on the defensive. They will continue to cautiously reduce discretionary spending and thus pressure the overall economy, which is now running on "slow crunch time". All those expecting a quick turnaround in 2008 had better adjust and learn to be patient.

There is an added dimension to this picture: the possibility for increasing demands for higher wages and salaries, to make up for lost purchasing power. If this situation continues unchecked for several more months, I wouldn't be surprised to see a resurgence in union activism, particularly in sectors where lower incomes predominate, e.g. retailing, food service and social services.

Therefore, crunch time applies to the Fed, too. The threat of structural inflation, not seen in a very long time, is already posing a serious challenge to the Fed's current policy. Highly negative real interest rates (Fed Funds at -2.00% now) may facilitate the salvage of the shadow banking system, but they also create inflation where it is felt the most by those that can afford it the least: essential food and fuel goods.

Tough choices ahead for the Fed.

Wednesday, May 7, 2008

Of Lifestyle Jobs and Gasoline Taxes

It seems that I keep coming back to the subject of jobs; yesterday's post on Las Vegas prompted a reader (thanks "thai") to ask what percentage of the economy is "leisure". Well, 12% of all private sector jobs are now classified as leisure and hospitality - incredibly, the same percentage as manufacturing. By comparison, in 1950 manufacturing jobs accounted for 36% and leisure for 6%. In other words, within a very short time, as history goes, the US gutted its industrial labor force by an astonishing two thirds while doubling "bread and circuses".

Adding healthcare to the jobs picture, employment in what I call the "lifestyle" sector jumped from 12% to 28% in the same period (private education, included in the chart below, is a minor 2%).

Type of Jobs as a Percent of Total Private Employment

The process of "dumbing-down" and reducing the value-added of the economy has been ongoing for a long time, but it accelerated further after 2001. Between 2001 and today the US shed 4 million manufacturing jobs and added 2 million leisure jobs, plus 3 million healthcare and social assistance jobs. This does not make for a vibrant, innovative economy and certainly not one that can quickly rise to the technical challenges posed by resource depletion and environmental degradation.

One of America's most attractive attributes has always been its economic adaptability. It came at the cost of a smaller social safety net versus other developed nations, but its benefits were also plain to see. A skilled and mobile labor force kept moving laterally and vertically to grasp opportunity as it arose. The labor force is still mobile, but how skilled is it?

As I have said before, manufacturing is key because it generates tremendous add-on benefits in technological R&D, education and competitiveness. Many claim that everything is still OK because we have Harvard, Columbia and MIT, to name but a few top-notch colleges. But how long will they remain world-class if we keep creating bartender jobs while China and India staff their factories and R&D departments with local graduates? Note that 60% of all engineering PhD's in the US are awarded to foreign nationals who can and do go back home to further enhance their nations' colleges and technological capabilities.

Until just a few months ago finance (+500,000 jobs since 2001) was also viewed as a sector where America held a comparative advantage and one that could serve as a substitute to manufacturing. How many still think so?

And, finally, what better sign of the decline in the once proud blue-collar sector than the populist pandering of McCain and Clinton, who keep pushing for a summertime repeal of the federal gasoline tax? Clinton mentioned it twice in her Indiana speech last night. How can anyone claim that 18.4 cents will make a difference with pump prices at $3.60? That's $10 per month for the average car, a difference that could be made up in half an hour by someone with even a semi-skilled job in manufacturing vs. a waiter on minimum wage.

If $30 or $40 dollars per year is such an important amount to the average American that it becomes a major campaign issue, then we have far more serious problems.

Tuesday, May 6, 2008

Viva Las Vegas!

Nothing proclaims "AMERICA!" more uniquely and loudly than defiantly gaudy Las Vegas. From dusty desert to "America's Playground" within just a generation, it has arguably become an economic thermometer, a neon sign (what else?) of flashing green or red, following the state of the Union's lucre. After flashing green for several years, the latest color is a light amber: The famed Tropicana just filed for bankruptcy.

Photo: Las Vegas News Bureau/LVCVA

The Las Vegas Convention and Visitor's Authority compiles a jackpot-ful of data on the number of visitors, conventioneers, gaming revenue, etc. stretching back to 1970. The following chart (click to enlarge) plots the gaming revenue of all casinos located in Clark County.

Data: LVCVA

Gaming revenues were up an anaemic +2.2% for the whole of 2007, while the first two months of 2008 are -4%. Obviously two months do not make a trend, but BINGO! it isn't, so far.

Meanwhile, after holding pat at roughly 130,000 rooms for several years, the Strip's casino operators are (belatedly?) betting on rollicking good times. Construction planned and under way is scheduled to increase hotel and motel rooms 29% to 171,000 by 2010. Convention space is also set to increase by 4.8 million square feet. Other proposals with as yet undetermined completion dates could add another 33,000 rooms and 8,000 time-share units.

Data: LVCVA

Monday, May 5, 2008

(Off The) Cliff Notes

We all know that new house sales have dropped off the cliff. The most common picture of the bubble's end is the chart below: the seasonally adjusted annualized rate of sales per month (click to enlarge). Looking at this chart alone we could be tempted to conclude we are close to a bottom and may soon see a rebound. Is this likely?

Data: Census Bureau

Dramatic as the above picture may be, it does not tell the whole story. The housing boom started in 1991 and lasted for an unprecedented 15 years, during which more houses were built and sold in the US than any previous cycle. Therefore, we need to include a longer view in our picture. Looking at the blue SAAR line above we observe that housing booms before 1991 lasted ~3 years. The next chart, then, includes a 3-year rolling total, i.e. how many new houses where actually sold in any three year period (red line).

Data: Census Bureau

We see that by this measurement the housing market is still far above historical lows. If 3-year total sales are to revert to the historical 1.5 million low, annual sales must stay at 500.000 per year for three years, or dip well below that before rebounding. The 15 year boom apparently created more housing supply than demand for shelter could realistically absorb, eventually leading to a speculative bubble. It will take a significant time to work off the excess physical supply of homes. How long will the downturn last?

For additional insight, let's look at home vacancy data: Homeowner vacancies are currently at an all-time high of 2.9% and of those vacant homes, a record 2.28 million units are for sale only, up from 1.39 million in 2005 (see chart below). That's another four years worth of supply at the current pace of sales, up sharply from one year's worth in 2005.

Data: Census Bureau

This additional supply of vacant homes for sale is now acting as a lead weight pulling down new home sales further. If annual sales stabilize at current levels, then housing could be in for another 6-7 years of sub-par activity before all the excess supply is absorbed.
____________________________________________

P.S. I noticed that Michael Klare has a new book out: Rising Powers, Shrinking Planet: The New Geopolitics of Energy. I consider him one of the most thoughtful and analytic writers on the topic of resource conflict and, unlike many others, he is an acknowledged academic expert in this field. In this book he focuses on the rising tensions between the US and other global powers - China in particular - stemming from access to energy resources. There is an accompanying article in The Nation.

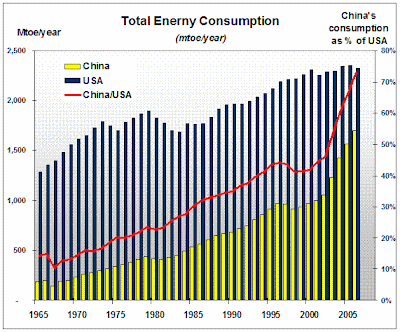
I constructed the following chart of total energy use (million tons of oil equivalent per year) in the US and China. The developments after 2000-02 are quite revealing: a sharply narrowing gap in the energy demanded by the two superpowers may lead to a collision course. Unless we start changing our energy regimes very soon, conflict over scarce resources cannot be ruled out.

Data: British Petroleum

Sunday, May 4, 2008

Peak Oil

This is not a peak oil blog and I do not wish it to become one. But as a finance professional educated in chemical engineering and one who worked on the design and construction of a couple of synfuel plants (way back when..), I have an appreciation for the connection between money, credit, energy, the economy and how our society's current model (Permagrowth) puts it all together into a complex whole - in my view increasingly unsustainable.

Money does not drive energy, but energy does drive money (and everything else). Thinking in terms of dollars per gallon is useful when going to the pump for a fill up, but unless we interpret price signals properly and comprehensively, it is likely that we will make profound mistakes in planning our future. When marking the price of oil in dollars we easily fall prey to notions about manipulation, political jiggery, terrorism, profiteering and a host of other "explanations", instead of hard facts.

In fact,then, the proper way to evaluate energy pricing is EROEI (Energy Returned Over Energy Invested). If the ratio is declining then energy is getting more expensive in real, BTU for BTU terms and eventually this situation finds its way into "dollar pricing", though things can get mightily muddled because money supply is artificially created and theoretically unlimited. Fiat money does not follow or depend on physical laws but "trust", a very dicey and evanescent measure of human psychology.

What do oil sands, drilling in very deep oceans, corn ethanol and resource wars (Iraq, Afghanistan..) have in common? They are very low EROEI energy sources compared to the rapidly declining high EROEI sources (e.g. Texas and Mexico). The fact that we have to increasingly depend on them to meet demand is the surest proof that "cheap" oil is rapidly becoming a thing of the past. And this, ladies and gentlemen, is as good a definition of Peak Oil as any.

In closing, you may wish to read this article from UK's The Daily Telegraph: Oil Is Expensive Because Oil Is Scarce.

For those not familiar with British politics, The Telegraph is a conservative-leaning newspaper. It has the largest circulation of any "quality" newspaper.

Saturday, May 3, 2008

Unemployed Part-Time

Payrolls declined by 20.000 in April, lower than expected (-100.000). However, looking just below the surface of the headline data reveals a fast deterioration in other job measures.

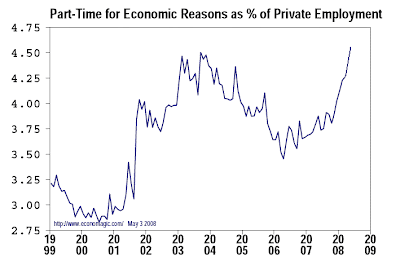
The number of people employed part-time for economic reasons, i.e. those that could not find full-time jobs or had to work part-time because business was slow, swelled sharply by 306.000 in April to a total of 5.22 million. This is the highest number since 1994 (see chart below, click to enlarge).
Number of people employed part-time for economic reasons (chart: BLS)

Such part-time employment now accounts for 4.52% of all private jobs, the highest percentage in 13 years and up from 3.4% two years ago (see chart below).

The Bureau of Labor Statistics counts everyone who worked 1 to 34 hours per week as employed and includes them in the headline payroll numbers, even though such employment clearly results in fewer hours and lower pay.

Taking this analysis one step further, part-time employment for economic reasons, i.e. forced part-time, accounts for 21% of all part-time jobs. This is also the highest level since 1994.

In summary, while the headline employment numbers are not declining as fast as during previous slowdowns, the qualitative job measures are worsening and are already at multi-year points.

The most likely cause is that employers, particularly those in the service sectors, are hoping the economy will rebound soon, so instead of fully laying off people they are cutting costs by forcing employees to work less, for less pay, i.e. forcing them into part-time un-employment.

What does this mean for the economy? Let's combine the poor employment picture with sharply higher costs for necessities such as food and fuel, the zero/negative saving rate and record high debt: the result is most likely going to be a continuing curtailment of discretionary personal spending. With personal consumption accounting for nearly three quarters of GDP, I believe we are in for a prolonged period of weakness.

Looking at just the headline BLS numbers is currently pretty misleading and may cause misplaced optimism.

Thursday, May 1, 2008

The Real Cost Of Black

A reader (thanks M3ANON) had this to say, by way of criticism to yesterday's post:

"To top it off you all seem to be in favor of rebuilding society on alternative energy methods that, at present, are not efficient or even self-sustaining. It might be a different matter if the alternative energy methods you all propose were actually efficient and capable or maintaining society as we know it..." (bold added).

I would like to address the two points highlited above, because I believe many people have similar concerns.
  • Alternative energy methods are not self sustaining or efficient.
Well, obviously solar energy is self-sustaining - for several million years more, anyway. Solar energy includes direct (i.e. solar panels) but also energy derived from the wind, waves, salinity differences, marine temperature gradients and biomass (am I leaving anything out?). Geothermal and tidal energy depends on the Earth's core and the Moon respectively and is also likely to last another few million years - unless a big asteroid hits.

Efficiency is measured by EROEI and all of the above energy sources now likely exceed "black" energy, when all costs are included. For example, the cost of maintaining the enormous US and other nations' military machines and occasionally fighting wars. Or the cost of environmental change caused by greenhouse gases. And how about geopolitical cost, to account for the very real risks arising from the increasing concentration of "black" resources in a handful of nations?
  • Maintaining society as we know it.
Can we actually maintain society as we know it? Society's ability to consume ever more (i.e. Permagrowth) was made possible with the enormous energy boost of fossil fuels. They are running out and are destroying our habitat, besides. So we have no choice but to change our society to better fit whatever energy is available. If we plan ahead wisely, changes will come with few major disruptions. But if we keep on pushing on the gas pedal we will just fly off the cliff.

Oh, we may maintain our society as we know it, allright. But what about our children's society? Are we willing to consume their future so we can maintain our present?