Sunday, January 31, 2021

Innovation And Bubbles

 I just came across a very interesting scholarly paper from the Yale International Center For Finance. It examines London's infamous 1720 South Seas Bubble, which saw share prices in shipping, trading, insurance and finance companies rise as much as 800% in a matter of weeks, only to collapse within days. Chart 1 below is from the above mentioned paper.

Chart 1

At the very top, the public's gullibility and folly had reached such heights that money was raised, and I quote, “For an undertaking of great advantage, but nobody to know what it is”. This quote may, in fact, be apocryphal, but it accurately reflects what was going on in that crazy time.

Yet, as you may read in the Yale paper, there was a “story” to the South Seas speculative frenzy, an otherwise rational driving force of innovation, new horizons and prospects for highly profitable trading ventures.  Innovation was then - and still is - a major factor in initially capturing the interest of informed investors.  What happens next, however, is crucial: if this interest expands to involve traders, speculators and the wider public, it can become a frenzy resulting in a bubble.

Chart 2, also from the paper, shows the massive overvaluation of  shares in “innovation”  New World companies vs. more traditional Old Economy ones.

Chart 2

Investing in innovation is, by definition, more novel and intellectually challenging than the established “old economy”.  It is best understood, at a rational, scientific level, by “intelligent” investors who can evaluate the business dispassionately.  However.... scientists are rarely, if ever, conversant with the  “animal spirits” part of markets and can very easily get blindsided by them. Case in point, the genius Sir Isaac Newton speculated and was bankrupted by the South Seas bubble.

Sir Isaac Newton, South Seas Bubble Victim

Innovation, in the form of a “story” which captures the public’s imagination, has been present at every bubble and subsequent crash: the Panic of 1901 (railroads), the Crash of 1929 (radio, aviation), the crash of 1987 (LBOs, junk bonds), the dotcom collapse in 2000, the crash of 2008 (subprime lending, credit derivatives, financial engineering).

Are we in for a repeat today?  You be the judge: Chart 3 is a comparison in share price performance between "innovative" Tesla and "old economy" Toyota Motor, the world's largest automotive manufacturer.  In just 12 months, Tesla soared 900% versus Toyota's 0%.  Tesla now has a market cap of $752 billion and Toyota $195 billion. Annual revenues: $32 billion and $280 billion, respectively.

https://tvc-invdn-com.akamaized.net/data/tvc_5857b7118d49b03034cc144045370a72.png

 Chart 3

Now, I'm not even remotely suggesting anything other than using those two companies as examples - and nothing else.  As always, please don't take this as advice, prediction - or even suggestion - for the individual companies and their stocks.  

If you want investment advice here are my two cents' worth: please consult a professional, NOT chatrooms, social media, influencers and the like. Or blogs.

Friday, January 29, 2021

The Devil Is In The Details, GameStop Edition

 The GameStop short squeeze (pump and dump, bull raid, call it whatever) is headline news so...

  1. When such arcane stories become headlines in the popular press, beware. It means the bubble is very popular and overinflated (aka who’s left to buy?).
  2. Such operations may seem novel, given the Internet and social media angles, but they are as old as the hills, including the “social media” angle. During the late 19th and early 20th century bull raids were routinely and intentionally leaked in newspapers and tip sheets in order to capture the greedy small fry speculators and thus complete the “pump and dump” cycle. Read all about it (and lots more) in Reminiscences Of A Stock Operator, originally published in 1925.
  3. When stocks become so wildly volatile within such a short time (Chart 1) brokers and clearing companies (essentially DTCC) have to protect themselves against the very real and highly increased  probability of “fails”, ie failure of a customer to pay for his purchase or to deliver the stock on settlement date T+5) (he has 5 business days from trade date). It’s not rare for a retail customer to renege if he has bought a stock at, say, $400 and two hours later it’s at $150 or vice versa, to deliver the stock. So, clearers will ask for additional intraday collateral from brokers who will then have to come up with the money immediately. This, in turn, means the broker will have to either (a) ask their individual customers for immediate cash (ain’t gonna happen, ever) or, (b) tap into their own cash and/or bank credit lines. In the case of the recent nonsense, we’re talking tens of billions, not chump change.
  4. Following along, will banks be happy to lend this extra margin money to the brokers? Trust me, they will not - the risk is just way too big that the money will evaporate into thin air. They may do it once to maintain their customer relationship (the broker), but they will do it under duress and only if provided with separate, high quality collateral.  And if it happens again, all bets are off: the margin “window” will close firmly shut, or the cost will be so high that it will be ruinous to borrow. This is exactly what happened in October 1929, by the way.
  5. Next step is to raise cash by selling out the customers’ stocks, which pushes down prices further, creating more margin calls, etc. Rinse, repeat.
  6. Customers accounts go into deep, unsecured debits which they cannot possibly or desire to meet, which means the brokers themselves are on the hook, and so they fail too.
  7. Dominos start crashing fast.  If one or two banks were stupid enough to keep lending margin money, they, too, will get swept into the hole. They will sell collateral to protect their margin loans... further dominos fall.
  8. The Fed will certainly step in to protect the banks by opening up the repo window wide, but that doesn’t mean the money will trickle down to the brokers. Quite the opposite, in fact: the banks will hoard whatever liquidity they get and will only lend against Treasury (or equivalent) collateral.
  9. We’ve seen it all before, and it always ends up the same way. Crash. 
  10. There’s nothing new under the sun.
  11. Addendum: the dominos are falling, huge margin requirements result in trade restrictions.

Chart 1

Thursday, January 28, 2021

Is The US Headed For A Debt Trap?

A debt trap is a situation where a country’s excessive debt load creates a vicious economic cycle of very low or negative credit expansion, high real interest rates and very weak growth or prolonged recession.  The cycle feeds upon itself, becoming self-perpetuating until something radical happens to break it (eg bankruptcy).

We have seen a recent full-cycle example in Greece, bankruptcy included. Italy is a mess and France is not  very far behind.  If it wasn’t for the ECBs massive QE operations the very existence of the euro would be in serious question. Another example is Japan, which went through 30 years of economic stagnation after its debt/bank/real estate/stock market  bubble burst in 1989. Iceland, Ireland, Portugal, Spain and Cyprus also come to mind.

Still, none of the above were/are issuers of the world’s reserve currency, therefore the negative impact on the global economy was/is manageable, if not downright negligible (certainly so in the case of Greece).

However, as US debt soars to unprecedented highs we now need to seriously consider the possibility that America could fall into a debt trap. The probability (P)  of it happening may be relatively small right now (although higher than ever), but the negative consequences (C) of such a development are enormous.  

So, we really need to pay attention to the equation:  R = P x C 

 where R is the consequences-weighted risk of a US debt trap.

 It’s a bit like the risk inherent in huge earthquakes - they don’t happen too often, but when they do they are truly catastrophic; so, it is prudent to take necessary measures well in advance. 

Let’s examine the US debt situation.

First up, the annual cost of debt service (interest alone) on all US government public debt as a percentage of GDP has increased substantially from 1.25% in 2015 to 1.75% in 2019 (Chart 1). During 2020, sharply lower interest rates were offset by higher debt and lower GDP numbers, so the debt service  jumped further to around 2.50% of GDP, the highest since 1998.  Note, however, that interest rates were much higher back then; for example, 6 month Tbills were around 4.50%.

Chart 1

Chart 2 shows the interest expense of the US government as a percentage of GDP (Y axis) for various average interest rates (X axis).  It assumes $30 trillion in debt and GDP of $21.5 trillion

Chart 2

What is more interesting, however, is interest expense as a percentage of total government revenue. Assuming the same revenue as in pre-COVID 2019 ($3.5 trillion), we get Chart 3.

Chart 3

Currently, even with near zero interest rates for Tbills, the US has to pay around 15% of its total revenue in annual interest.  Since the government is running a deficit, this expense is not actually “paid” - it’s just added to the debt load in the form of issuing more bills and bonds.

It is quite obvious that even a small increase in interest rates back to more “normal” levels, will rapidly escalate the annual debt service cost and create a dreaded vicious cycle leading to unthinkable insolvency - if revenues don’t increase, that is.

Therefore, it is clear that the US government needs to raise revenues significantly and must do so immediately.  Fortunately, corporate and wealthy individual income tax rates are near all time lows and could be raised significantly.  Other taxes should also provide additional revenue: increased capital gains and wealth taxes can be instituted with immediate effect, particularly with financial assets now at record high level.  The wealth gap is so wide now (see previous posts) that targeted tax increases will be very popular with the vast majority of tax payers (for once, “sock the rich” will not be just political hot air - it will also raise substantial revenue).

Back to the R formula: the probability P of a US debt trap is rising fast, as can be seen from Charts 1-3 and the consequences C are pretty easy to imagine (very large).  Therefore, risk R is also growing fast and must be reduced immediately. 

 Raise taxes, period.


Tuesday, January 26, 2021

Very Sudden Debt

There was never a time when the title Sudden Debt was more apt than right now. Federal debt has exploded to 130% of GDP (Fig. 1) , and when Mr. Biden’s new $2 trillion program is added it will jump to 140%.  Such a debt burden may be acceptable for countries like Italy and Greece, or even Japan, but certainly not for the country claiming to be the Leader Of The Free World and issuer of the global reserve currency.


Figure 1

Talking heads are trying to underplay the (sudden) debt, claiming that what really matters is the annual cost of debt service, currently manageable because of near zero interest rates.  Indeed, the average interest rate on all government debt is now 1.7%, down from 2.4% last year (Figure 2).


However, notice that this happened almost entirely because short term (up to 12 months) T-Bill rates have come down to near zero (red arrow above).  Outstanding marketable US debt is, in fact, very short term with its average maturity now down to 62 months or perhaps even less (Fig. 3).
Figure 3 
That’s because T-Bills and Notes up to 2 years make up $16 trillion of the total $28 trillion debt. Another $6.5 trillion are special issue bonds held by the Social Security trust fund. They are, indeed, very special issues: they pay interest at the average of all Treasurys with maturities over 4 years, but they are redeemable at any time at face value. So, in fact, their maturity is zero (Fig. 4).

Figure 4 

Doing just a bit of math we see that the real average maturity of the entire US debt is around 48 months as of 12/31/20. In other words, it’s very short term and thus very susceptible to refinancing risk. In 2019 the government’s interest expense was ca. 1.8% of GDP or 15% of all government revenue. As things stand today these figures are likely significantly higher and slated to rise even further due to Mr. Biden’s  additional $2 trillion debt package.

The Treasury is not financing all this additional debt by selling bonds (well, bills mostly) in the open market, of course.  They are purchased (or repoed) almost entirely by the Fed which thus prints 100% deficit money to be dumped by the proverbial helicopter onto the US public.  The Fed’s balance sheet has ballooned from $4 trillion to $7.5 trillion in less than one year and will go to nearly $10 trillion soon, when Mr. Biden’s $2 trillion are added (Fig. 5).

In case you are wondering, that’s the country’s central bank holding debt equal to almost 50% of GDP.  Is it sound banking to lend so much to ONE borrower?  Obviously, the Fed’s supposed independence has now gone completely out the window. 

Which further begs the question: if the Fed is lender of last resort, savior of the financial system when it crashes... who will save the Fed? 

Figure 5 

Make no mistake: this has never, ever happened in the US before, not even during WWII which was financed with war loans, bonds and stamps sold to the public.


Bottom line: if the US economy does not come roaring back within just a few months, all of this huge deficit spending will raise serious questions about the country’s ability to continue meeting its debt obligations in an orderly fashion.  The dollar will weaken, interest rates will go up and the vicious cycle very familiar to over-indebted countries shall take hold in the US.   End of Empire.

Unthinkable? I think not.


Monday, January 25, 2021

It's A Volat(oil) World - Tail Events

I touched on tail events on the previous post and how they can precipitate entirely unforeseen consequences.  Let’s look at this in more detail.

First, a recent example.

Last April WTI crude oil front month futures traded at an unprecedented -$35 per barrel, ie. sellers had to pay buyers (Fig. 1).  The  sudden collapse in demand due to COVID lockdowns created a physical oil glut which filled all available storage tanks at the authorized delivery locations. No one wanted to take delivery of oil, at any price, simply because there was nowhere to store it.  

No one ever imagined negative oil prices, but they happened and  that’s the very definition of a “black swan” or, in more mathematical terms, a “tail” event (ie at the tail end of a probability curve).


Figure 1

Switch to today. As financial markets soar to ever higher highs they predict an ever rosier future for the US economy, and the risk/reward balance overextends heavily towards risk (Figure 2).  It is therefore more probable that a “normal” negative event will produce a proportionately bigger drop than otherwise, something like a reversal to mean, while a totally unexpected “tail” event may have entirely unexpected consequences, something analogous to negative oil prices.

Figure 2

Let’s let our imagination run wild..

What’s the most unthinkable scenario for stocks if a true tail event happens?  Well, I can’t see how negative stock prices could occur, but... how about zero?  Or thereabouts? What if no one wanted to part with cash all of a sudden, no matter how attractive the offered price?  What if margin money disappeared, or became so expensive as to be practically unavailable? 

What if some or many CFD counterparties could not honor their contractual commitments and failed, creating a domino effect? CFDs work on razor thin margins and the brokers as a matter of standard routine immediately close out losing client positions once the margin money put up as collateral evaporates.

Imagine a day that opens with a gap down of 10%, creating a tsunami of automatic closing out sell orders which avalanche through the system. Will “real money” institutional investors step in? No way, they’re not stupid to catch a falling knife and, anyhow, they already know this is a bubble. Margin calls to cover the excess losses will be automatically executed since these days trading accounts are linked to speculators’ bank or credit card accounts. Remember, with margins as low as 2%, a 10% move generates losses 50 times greater, ie 500%. If XYZ stock is down $10 the loss on the account will be $500.

What could lenders do? Well, exactly what they did in October 1929: quickly shut down the margin lending window, creating even more selling pressure to raise needed liquidity. Even if most brokers run a square book, even a few counter-party failures will quickly spread and force everyone to hoard cash. Ergo, no buyers at any (reasonable) price.

But that’s what the Fed is there for, right? Lender of last resort and all that jazz? Ok, but lender to who? Joe Bloe plunger from London? Or Stavro Bloefeld credit manager of the AlphaBet CFD platform in Cyprus? Oh, maybe their prime brokers will act as intermediaries? Yeah, right, like they won’t  remember what happened to Lehman and many more back in 2007-08.  Remember, it was not the Fed who saved the likes of AIG, Citi, Merrill, et al.  It was the Treasury Secretary who blackmailed financial industry leaders into saving their failing brethren by threatening a complete government takeover.  (Paulson could do it because he was the ex CEO of Goldman and knew exactly how to do it, he was one of them and could stare them down.  You think Janet Yellen could do it? Not in your, or her, dreams.)

From my own experience I tell you that when panic rages it’s every man for himself. You sell first and ask questions later. I was there in October 1987 when credit managers were going around from desk to desk screaming at brokers “your customer has 30 minutes to bring in a check/wire or I’m selling him out”.  With e-banking, today that 30 minute window is now more likely 30 seconds. And 1987 may be considered a hiccup today, but it was a bigger single day drop than even Black Monday in 1929.

Index tracker funds are very likely another potential accelerator, particularly “short” ones that promise 2 and 3X performance.  I won’t go into detail, but you can see how they would be forced to sell into a down market.

Now, compound all of the above with algo and flash trading which make up as much as 80% of daily volume, creating a false sense of market depth and breadth. Such systems have “circuit breakers” which will shut them down immediately.  This leaves only “real money” traditional investors, people exactly like Buffett, Munger, Dalit, Grantham, et al.  Most all of them are already on record saying we are in a bubble, so they won’t buy until the blood flows...

In summary: this is a very thin and very narrow market masquerading as a real, structural bull market. It is highly susceptible to some kind of black swan event which will produce very, very high volatility.

What could that tail event be? I have no idea.  By its very definition, a black swan is an unknown-unknown.  But we know they exist, even though the market is behaving as if they don’t...


Saturday, January 23, 2021

ETFs CFDs Bucket Shops and 1929

The worldwide number of Exchange Traded Funds (ETFs) has soared 20-fold since 2003 and their assets in the US alone has increased even more by 30 times to $4.4 trillion.  Keep in mind that these are 2019 numbers, so they are certainly higher today.


Take a guess what was the most popular retail product for “investors” in the years leading up to the Great Crash of 1929? Yessiree Bob, exchange traded funds - they called them Trusts back then.  And guess what?, just like today they made speculating on margin even more leveraged than regulations allowed. Trusts leveraged their portfolios and then the buyer could again margin the Trust shares on his own account.  So, with margin set at 50% (2x leverage) the investor could ramp his leverage up to 4x  (Some erroneously believe that margin requirements were as low as 10%  and that’s what accelerated the crash, but that’s not so. Margin for stocks was at 50% back then, just as it is now).

Now we have 2X and 3X S&P 500 or NASDAQ 100 index tracker ETFs that go up (and of course down)  double and triple as much as the underlying index. Put that baby on 50% margin and... guess what? Your effective leverage is 6X. If you’re not worried about what that means in a sudden market break...you should be. I mean... seriously, we’re talking trillions of dollars here and those products are 100% retail.

Next subject is Contracts For Difference (CFDs).  You (but not if you’re in the US) can go into your favorite electronic trading platform and buy a CFD on just about any stock or index They are NOT stocks themselves, they are agreements between you and the broker that they will credit/debit your account with the difference between the stock prices shown on the regular exchange at the time of sale and purchase, respectively.  I say it again, you are not investing, you are merely punting on a move, up or down. And again, guess what? Because CFDs are not securities they are not bound by margin regulations and, in fact, are typically margined as low as 2%, ie you leverage 50 times. Yes, fifty.

Ever heard of bucket shops? That’s exactly what they did back in the 1920s. Only thing is, they posed as legitimate stockbrokers because such CFDs were illegal and they often got raided by the police.  But today... OMG they’re legit!! Outside the US, anyway. 


So, dear reader, and particularly if you are an old reader, we’re back to the lunatic alphabet soup era. Back in 2007-08 it was subprimes, bonds, tranches and credit derivatives ABS, CMO, CDS, CDO, etc etc. Today, it’s stocks, funds, ETFs, CFDs and huge leverage.

There’s nothing new under the Sun.  Loonie valuations for “new technologies”(it was radio in the 1920s), lots and lots of small speculators, easy money, high leverage - it all looks awfully similar to 1929. Oh, and just like in 1929 there’s an unshakable, almost religious belief that the market can’t go down because...of a “permanent high plateau” in the economy (1929) or that the Fed will keep pumping liquidity and support markets,  no matter what (today). Remember the 2006-07 meme? Mortgages just don’t default, not above a very small percentage? Right-o and away we go... 

Scared yet?  I think we should all be... because a black swan, aka tail event can - and always does - appear out of nowhere. More on that tomorrow... 


Friday, January 22, 2021

Smoke And Mirrors, Literally

 RLX Technologies, a Chinese vaping company just did an IPO to raise $1.4 billion. That’s a lot of money for smoke, but that’s not all: it listed on the NYSE and on the first day of trading its shares jumped 133% from $12 to $28 giving RLX a market cap of $44 billion.  That’s 1,900 times annual earnings... for smoke...to be clear: that’s one thousand nine hundred times. Oh, and a mere 97 times revenue.

Does every man, woman and child on Earth vape?? I guess they must!!

You know, Tulipmania was sane by this measure...


If You “Get It”, Get To Work

A day before Mr. Biden’s inauguration I posted on my personal FB page that the US is “mindlessly hurtling towards civil war” and a friend called me “a bit dramatic”. But, Mr. Biden in his speech called for an end to the “uncivil war” in America.  As he said, “I get it”. Question is, what does he get? What must he, his administration and both Houses now controlled by Democrats do to prevent a “real” civil war?

In yesterday’s post I presented jobs data to point out the declining fortunes of America’s once mighty middle class.  Today, I present data from a Pew study on income and wealth inequality. As usual, pictures are worth thousands of words - after all, I did study engineering (smile).

First up, the income gap between upper and middle class households is rising and, even more importantly, the middle class share of aggregate national income has plunged while that of the higher ups has soared. As an Army field officer would say, the center is not holding..


Next, the wealth gap  has widened enormously from 28% in 1983 to 62% today.

This is not about the rich getting richer and the poor poorer. Sure, that’s always bad, but not nearly as consequential and dangerous for the very existence of the American Empire as the middle class getting whacked, while the rich get incredibly richer.  It results in a paycheck to paycheck subsistence/existence, addiction to online pass times, poor health, anger and depression. The rich become trillionaires (!!) jetting to Aspen, Dubai and Zermatt, while the so-called middle class stays at home with Netflix and Twitter.  That’s definitely not “fair” and certainly not the American Dream. 

Who is to blame? Wouldn’t you know it, Americans blame it on losing their jobs to China (what I pointed out yesterday) and a tax system that favors the rich. 


And who do Americans expect to fix these inequalities? The Federal government and big corporations.
Bottom line, Mr. Biden has his work cut out for him.  Americans don’t want handouts, but good jobs and a fair tax system that makes corporations and the wealthy pay more in taxes.  The next few days and weeks will show us if Mr. Biden truly “gets it” and starts to rebuild the American middle class.


Thursday, January 21, 2021

The Annihilation Of The American Middle Class

 As Mr. Biden assumes office, the question remains: what produced Trumpism? Why does a huge 34% of all Americans still approve of Donald Trump, even after all his antics, his abject failure to handle COVID, the Capitol raid and two Impeachments? Is it just a passing personality cult or is it something much deeper and more serious? IMHO, it’s the latter.

Gallup Poll

I believe Trump has touched a nerve with tens of millions of angry middle class Americans who have seen their relative living standards deteriorate sharply over the past 40 years. He is a symptom, not the cause of the deep American divide. Unlike most, I see this schism as almost entirely socio-economic (who has how much) instead of cultural-political (who believes what).  Let me put it this way: if your belly is full you don’t storm the Bastille (or the Capitol), not really.

Let’s look at some numbers.

Manufacturing employment in the US topped out in 1980 at nearly 20 million workers, accounting for 27% of all private sector employees.  It has since receded to just 12 million, a mere 9.3% of the private sector.  That’s a precipitous 66% drop in just one generation!

The Middle Class Train Has Derailed

The unionized factory floor served as the prosperity locomotive for America’s postwar baby-boom middle class. It has now derailed, its passengers left to find other means to get ahead in life. (Yes, productivity has risen sharply but that mostly means higher profits for the corporations, not much higher wages).

What has taken manufacturing’s place? One very big sector is Hospitality and Leisure (restaurants, bars, hotels, theaters, etc).  Since 1980 employment there has increased from 6.8 to 17 million (pre-COVID), or from 9% to 13% of all private employees. But that’s not all...
The Rise Of The Burger Flipper 

Factory jobs were (and still are) much better paid and have better benefits.  They pay on average $29/hr vs $17/hr in hospitality and offer much better benefits (eg 84% of them have an employer sponsored pension plan vs. 33% in hospitality).

Here’s another statistic: in 2000 16% of factory workers were represented by a union vs. 4% in hospitality.  Today, those numbers are 9% and 3.5%, respectively.  Manufacturing employees have lost a lot of bargaining power whereas hospitality ones never had any to begin with.

In sum, the jobs that replaced factory positions are really, really bad. The American Dream road that lead straight from high school to assembly line is no more. Even a Bachelor degree is no longer a ticket to a relatively comfortable lifestyle, as seen in the next charts from a study by the Congressional Research Service.


I recently read someplace that even American professionals (lawyers, engineers, accountants, etc) nowadays consider themselves relatively “poor” or “unprivileged”, which just goes to show how far the middle class has been squeezed.

In sum, Trump felt and unashamedly exploited a real social problem that has been brewing for decades.  Someone has to solve it, and soon, because he certainly didn’t...

Wednesday, January 20, 2021

Heat Maps

Another two charts today, first one again courtesy of Yardeni Research.

The stockmarket Bull/Bear ratio is a good sentiment indicator.  Notice how it has become almost entirely red (over 3 times more bulls than bears) in the last 6 out of 7 years.  The 2015-16 pause must be attributed to the highly unusual Presidential election period which resulted in Trump who then proceeded to slash corporate taxes to the lowest level in 80 years.

And here's another stripe chart from the World Meteorological Organization...


I'm troubled to find the two oddly correlated - do you?


Tuesday, January 19, 2021

Two Charts

 I really like Yardeni Research for its in-depth economic analysis.  You will find the link at the right margin.  Here are two charts I find interesting.

The first one is the yield spread between high yield (aka junk) bonds and Treasurys.  It is a very good indicator of risk appetite and it is currently back to near all time lows, ie risk appetite is very high.


The next chart goes a long way to explain the American middle class malaise.  Manufacturing has been stagnant for 20 years - well-paid jobs on the assembly line are becoming ever scarcer as the population grows.  In my opinion, that’s the source of Trumpism, MAGA and, conversely, the awesome rise of China.


Monday, January 18, 2021

The Real Deal Bubble

Lets talk bubbles.

For one, a bubble is not "real" until after the fact, i.e. after it has burst. It then becomes so obvious that people shake their heads in disbelief at their blindness.  The Emperor's New Clothes, the tale by Hans Christian Andersen, is a perfect example of mass suspension of disbelief.  Yet, the signs are there to see beforehand, obvious to anyone who is willing to see with his very own eyes instead through the viewpoint of mass, crowd hysteria.

Why would a single tulip bulb sell for as much as a house? Why would anyone, including the genius Sir Isaac Newton, participate and be fleeced in the South Seas madness?  Why would anyone believe that subprime loans could be sliced, diced and tranched into AAA bonds, which were then used for credit derivatives, which were in turn turned into more AAA bonds?  Cutting cow apples into small pieces doesn't turn them into gold, does it? Duh...

Excess -  in and by itself - is not a very good indicator of bubbles, however.  The one element that is, however, is a screaming imbalance between present fact and projected future.  For example, back in the Credit Crisis of 2006-08 many mortgage lenders, brokers, etc were already failing and/or reporting big increases in non-performing loans (fact), yet markets were ignoring the news and kept on making new highs, projecting a rosy future forever.

So, what about today? What is the present imbalance?  In my humble opinion, it's the obvious decline of the United Sates as a stable, superpower Empire (fact) contrasted to the stratospheric level of stocks and near zero interest rates for bonds (projected future).  This imbalance is so major, of such historic proportions that it goes unreported and under-analyzed by most media.  I mean, yes, the Capitol stormed by the "unwashed masses" was in every front page, but it was mostly brushed off as an extremist event.  To that I say... remember the Bastille or, more recently, the Berlin Wall. 

                                                                     End Of Empire

Another fact that markets continue to ignore is global warming and climate change.  The absolutely necessary changes in our Permagrowth model will impact the level AND makeup of economic activity.  Business cannot go on as usual, consumers cannot go on buying $1 t-shirts or (more importantly) paying $1,000+ for yet another, newer edition of a smartphone, tablet, whatever.  Transforming our society and economy to a Sustainable Model will create new businesses BUT... the overall direction will be towards less of everything. Think of Greta Thunberg as the child who pointed to the Emperor and said.."but, he's naked!!". If you don't like Greta, remember Al Gore and his Inconvenient Truth, which is now becoming A Clear and Present Catastrophe.

End Of Permagrowth

Therefore, two very, very large "facts" are pointing to one direction while markets are obliviously whooshing towards another.  And that, friends, is The Real Deal Bubble.


Friday, January 15, 2021

Best Wishes For A Gappy New Year ;)

 Charting is a really arcane type of market analysis and, for the most part, pretty useless as a predictive tool.  At best, it should be attempted using a very, very thick pen (thick mouse pointer these days).  Still, there is ONE basic principle that has proven pretty accurate over many years - in my experience, anyhow: gaps get filled.

To this end, here is a daily chart of  Dow Jones Industrials.  The gaps that have been formed on the upside are at 28500, 23700, 21400, 19100 and remain unfilled (blue arrows).  The red arrows show gaps that were formed on the downside and have now been filled as the market rose.  A similar pattern can be observed at S&P 500 at 3390, 2870, 2530 and 2300.


I'm posting this as a companion visual aid to my previous post (Jan. 13, 2021) on Jeremy Grantham's warning about the current bubble.  Good luck!

PS If you really want to go gap hunting, take a look at Tesla... aaaaaaallll the way down 😆😆


Stop The Presses

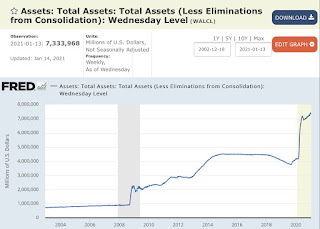
 President-elect Joe Biden just signaled his intention to boost the US economy with yet another stimulus package of $2 trillion that will rain down money from the helicopter.  Where will it come from? It will be printed by the Fed out of thin air, of course.  To be exact, the Treasury will issue bonds and the Fed will buy all of them, boosting its balance sheet to unimaginable levels (see chart).


Just 12 years ago the Fed’s assets were a mere $1 trillion.  Today they come to $7.3 trillion and, if Mr. Biden goes through with his plan, they will soar to $10 trillion or 50% of GDP. In case you don’t comprehend what this means, it’s really very simple: the government/Fed is printing money. Since the economy is stagnant, this is a debasement of the currency, pure and simple.  The hope is that this torrent of money will kickstart the economy because the recipients will spend it on.... what??? Imported clothes, tablets and games?? (Note: imports are subtracted from GDP).

In hopes of obscuring reality, talking heads are giving this most ancient of government currency debasement actions a new name: it’s now called Modern Monetary Theory.  Oh, sure, the excess money is supposed to be drained in the future future by increased taxation..  but, show me a politician who promises to raise taxes and I will show you a unicorn.


Wednesday, January 13, 2021

A Real Market Legend Speaks: Is Anyone Listening?

 Jeremy Grantham is one of the most successful asset managers in history. This is what he has to say about the current bubble in stocks and bonds... in sum: it’s a bubble of epic proportions, equivalent, or worse, to the South Seas, 1929 and dotcom bubbles. I agree 100%.

PS The dissonance between the US political situation (the Capitol stormed, 5 dead !!) and the raging bull in stocks is astonishing.

https://www.gmo.com/europe/research-library/waiting-for-the-last-dance/