Thursday, April 28, 2022

Inflation, A Milton Friedman Chart

 Milton Friedman once famously said:

“Inflation is always and everywhere a monetary phenomenon, in the sense that it is and can be produced only by a more rapid increase in the quantity of money than in output.”

IMHO his statement is self-evident.

How is the US doing in this respect? Is the currently soaring inflation due to the pandemic "supply chain disruptions" and the war in Ukraine? Or is it "a more rapid increase in the quantity of money than in output"?  I believe that the chart below makes things perfectly clear.

The line is the ratio of M3/GDP in current dollars, ie by Friedman's definition above, "the quantity of money" divided by "output".  Notice how the line has varied very little for 50 years between 0.5 and 0.6, until around 2010 when the Great Debt Crisis forced the Fed to pump much more money into the system.

M3/GDP ($/$)

The pandemic then threw money creation into overdrive, as QE printed money in unprecedented quantities, justified (?) by the Modern (?) Monetary Theory (MMT) which claimed that the money tsunami is perfectly ok because GDP growth will eventually catch up. 

Well.... MMT is not working, at least not yet: the ratio soared to 0.90 and doesn't show any signs of going down fast, despite record GDP.  Instead, inflation soared - as Milton Friedman would expect.

==> It is all the more urgent for the Fed to start QT-ing in size.


Monday, April 25, 2022

War In Ukraine: A Monetary Perspective

What if the war in Ukraine has nothing to do with NATO, democracy vs. dictatorship, freedoms vs. tyranny? What if it is all about the Fed and ECB creating trillions in pixel currencies out of thin air, inducing the world’s largest producer(s) of non-renewable resources, who have to sell them priced in exactly those currencies, to decide “the hell with this, I’m raising prices in any way possible, including war”? 

First, some charts:

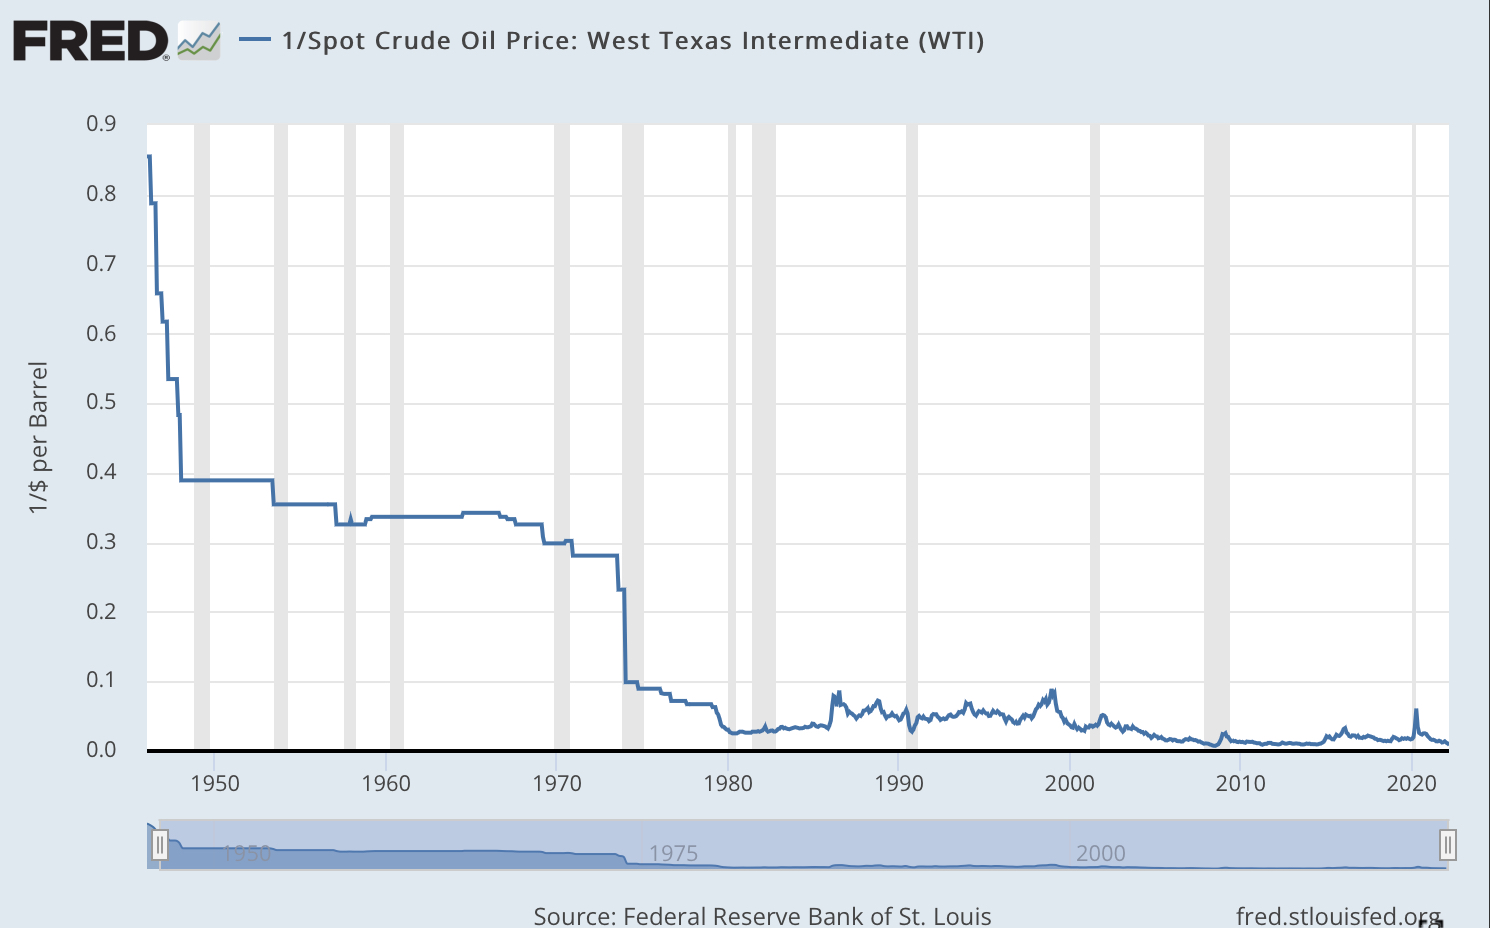
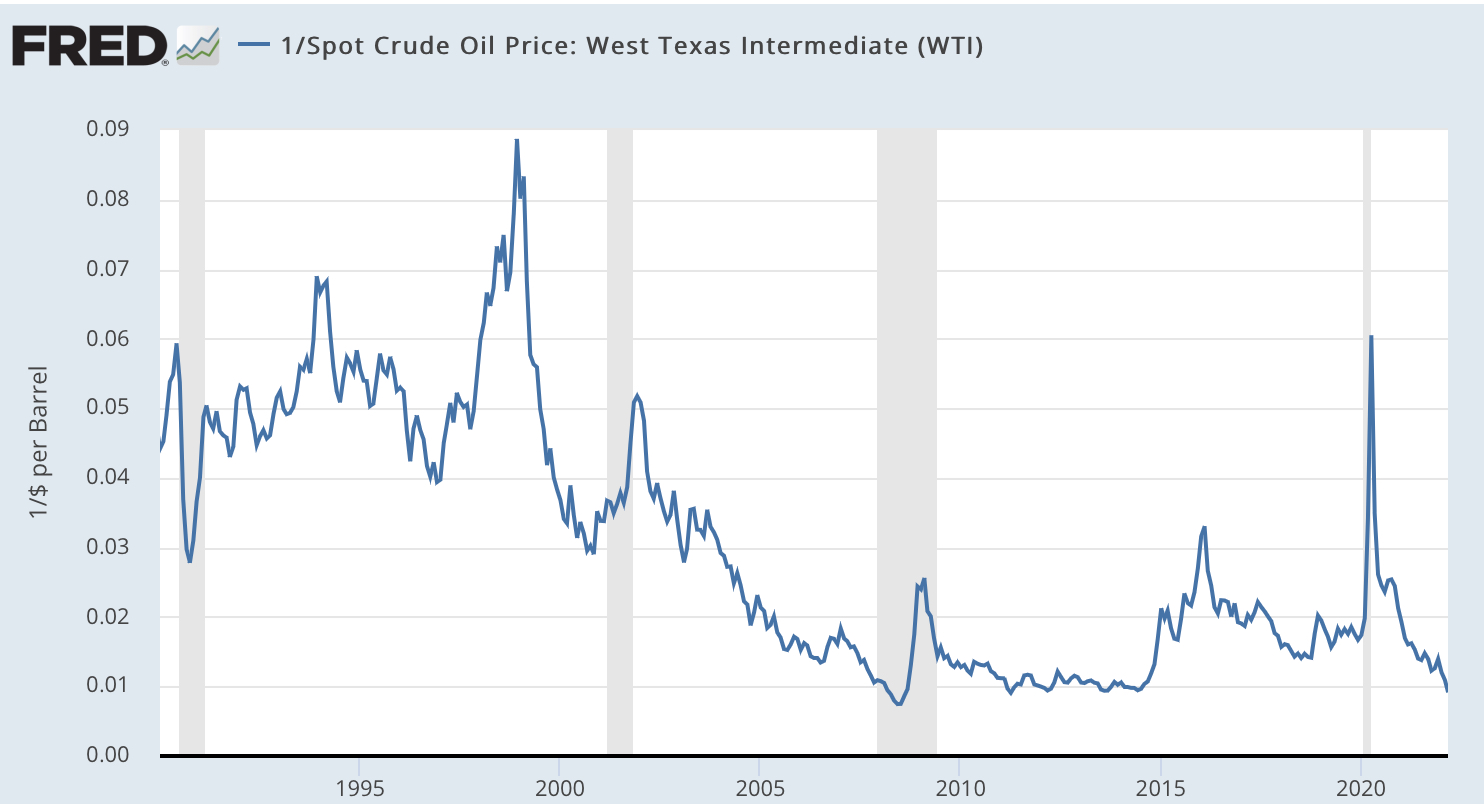
  • The price of the US dollar in barrels of oil (1/WTI oil price), longer term and more recently for better scaling. Back in 1945 the dollar was worth almost 1 barrel of crude oil, today its value has evaporated to less than 0.01 barrel. That’s a 100-fold dollar devaluation against a real product/asset.


  • Next, the amount of dollars created in the same time (M3). Notice how the slope of the curve, ie the rate at which dollars are being pixelated, keeps getting steeper over ime, culminating in a near vertical rise during the pandemic.

  • Ditto for the euro, albeit at a somewhat less rapid rate.  The inflation-weary Bundesbank is still influential within the ECB, after all.

  • Here’s a chart of both them together, the sum of dollar plus euro M3.


To summarize: in the last 20 years there have been 28 trillion more dollars and euros created vs. zero more barrels of oil and bcf of natural gas. You are Putin and you are forced to sell your constantly diminishing assets in ever expanding dollar and euro pixels. What do you do? Hint: he’s demanding payment in roubles.

Corollary: start QT (quantitative tightening) right now and don’t be stingy, either. Amazing as it may seem with inflation at 9%, the Fed (and ECB) are still QE-ing, albeit at a much reduced pace, from $160 billion to $20 billion per month - see below. 


Saturday, April 23, 2022

SPACe Cadets

 Following up on the last post, remember where the Great Debt Crisis hit hardest? It was at those CDO “investments” constructed from putting together a bunch of junk loans and then chopping them up into tranches ranging from AAA all the way to Z.  It was a financial alchemist’s dream, transmuting horse doodoo into “gold”. Naturally, when the party stopped the “gold” immediately reverted back to its original state and suddenly defaulted.

History rhymes: in the last four years we have witnessed the astonishing popularity of SPACs, Special Purpose Acquisition Corporations, aka blank check companies.  Investors give the organizer their money without any prior knowledge of where it is to be invested, except perhaps a very general guideline, eg healthcare.  Sounds like the height of folly to me, but like PT Barnum said “there’s a sucker born every minute”.

Here’s how much money was raised in the last five years (see chart below).  In 2021 alone people “invested” fifteen times more than just three years ago.

So, where’s the problem? For one,  SPACs impose huge initial fees and expenses, on average 16% of the capital raised. Plus, they have ongoing running expenses - management, accounting, legal, etc. Figure another 5% annually, and that’s on the low side.  Secondly, and crucially, if SPACs don’t invest the money (ie merge/acquire a company) within 18-24 months of listing, they are obligated to refund 100% of the money raised, usually plus interest. 

It is currently becoming VERY difficult for SPACs to find suitable private companies to buy/merge with. SPAC investors must approve every acquisition - and if they don’t they are entitled to get their money back.  Remember those huge fees and expenses? Does anyone think that SPAC  organizers will just shrug their shoulders, open their own pocketbooks and send out money they have already spent? Fat chance…

IMHO there’s a lot of SPACe cadets in serious trouble out there….


Friday, April 22, 2022

Acronyms Are A Bitch!

The last few years have seen the creation of a new batch of financial market acronyms:

  • TINA: There Is No Alternative (to stocks)
  • FOMO: Fear Of Missing Out (a market rise)
  • BED: Buy Every Dip
Along with those, we got yet another alphabet soup of product-specific initials: SPAC, ETF, CFD… harking back to the CMO, CDS, CDO of the Great Debt Crisis of 2008-09. And we all know how that ended. Seems like the more things change, the more they stay the same.

So, since market sentiment always goes full circle,  maybe we will eventually get yet another set of acronyms:
  • NBC: Nothing But Cash
  • FEDEX:Fed Executioner (of markets)
  • DoBAS: Don’t Buy Anything, Silly!
  • SEGA: Sell Everything, Go Away
  • FOGG: Fear Of Getting Gutted
When those start appearing in the popular press - sorry, I meant social media 😜 - it will be time to start examining going long again. But not before, I think.

PS If you come up with your own acronyms in the comment section, I’ll add them above - with credit, of course (keep it PG13, eh?) 😊

Sunday, April 10, 2022

How Far Behind The Curve Is The Fed? Very

 When inflation first started rising during the pandemic, the Fed insisted it was the temporary effect of supply chain disruptions.  And then it kept rising… and rising… and the Fed kept insisting. And then… war happened, and prices of everything from gasoline and food, to fertilizer and cement soared.

Was it the pandemic? Is it Putin? Or, is it because the Fed printed almost $6 trillion in a mere year and a half? You know what I think…yup, I’m with Milton (Friedman) on this.

The Fed is now (ever so slowly) coming to terms with monetary reality, and is starting to talk tough on inflation, planning to raise rates and even -gasp!- shrink its balance sheet by selling bonds outright to the tune of $90 billion per month. 

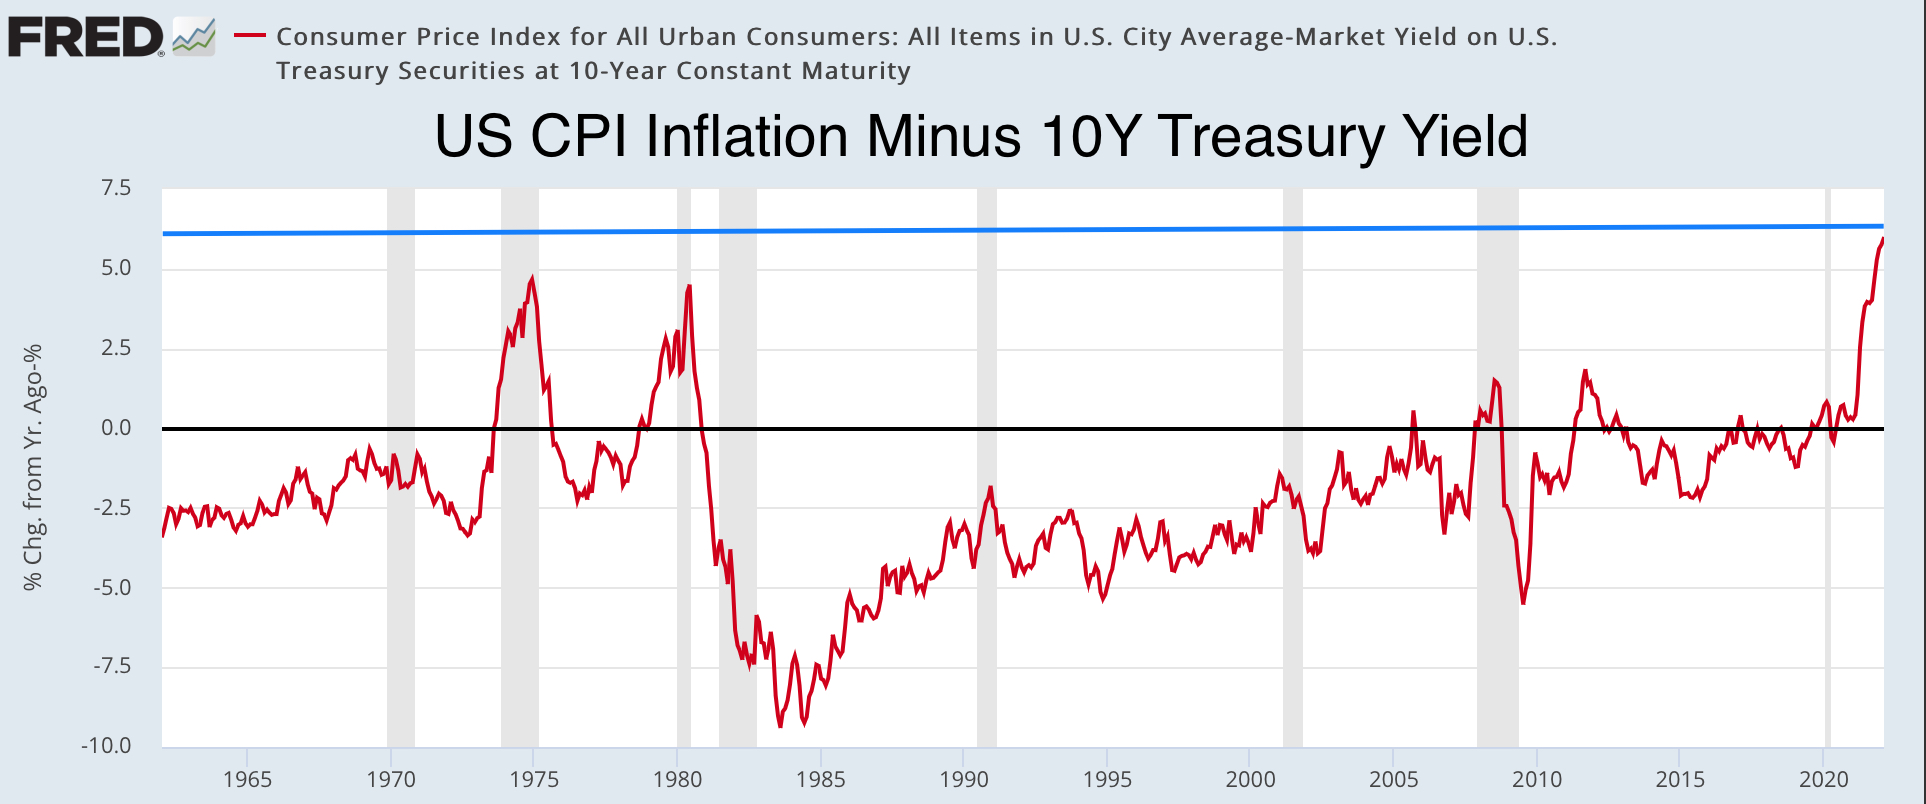
So,  how far behind the inflation curve is the Fed, how tough does it have to get to tame it? 

In a word, very! Look at the two charts below: the spread between inflation and Treasury bond and bill yields is at all time highs and must come down fast, one way or another.  Which way will it be? My bet is… both: interest rates will rise and inflation will eventually subside due to lower aggregate demand resulting from a recession.


Saturday, April 9, 2022

Fed On The QT Path

 The Fed has all but officially announced that it will soon start shrinking its bloated balance sheet by approx. $90 billion per month.  And rightly so given the explosive inflation we are experiencing. After all, inflation is a monetary issue: explosive money printing ALWAYS results in explosive inflation.


The Fed Created $3 Trillion In Mere Months….


..And Inflation Soared A Few Months Later

The money flood has found its way into every nook and cranny of the economy, from auto prices to looney “assets” like meme stocks and NFTs.  And, of course, into plain vanilla assets like the S&P 500: print money ==> stocks go up.


Explosive Money Creation Resulted In Explosive Stock Prices

The chart above shows the yoy money growth (red line) and yoy change in S&P 500 (blue line): the correlation is obvious.  Now, if the Fed actually does go into a Quantitative Tightening mode (QT) by selling bonds outright from its portfolio in order to shrink its balance sheet, the red line will move below zero.  Will asset prices follow? IMHO, yes. 

Stay tuned, and carry a big parachute!


Tuesday, March 29, 2022

Biden’s Billionaire Tax

 President Biden has proposed a new 20% “billionaire tax” for his 2023 budget. 

Here’s a dumb question: given that (a) it targets the uber rich (b) the current top personal income tax rate is 37% starting at over $540.000… why is the billionaire rate only 20%? Wouldn’t 37% be more just - to say the least?  Better yet, shouldn’t there be an even higher bracket - say, 50% ?

After all, 22% tax is levied on those with income over just $40.500. Not exactly members of the Billionaire’s Club..


Monday, March 28, 2022

Cut Consumption, Kill The Bear

 Conventional wisdom: The West has shown remarkable unity in imposing sanctions against Russia.  They will hurt the invader so much that it will quickly back down and stop the war.

An alternate version: Russia and Ukraine combined control huge percentages of global exports of the most essential goods of all: energy, grains and fertilizers. Russia can sustain a lack of mega yachts, Mercedes, Louis Vuitton and Dom Perignon indefinitely, while the West freezes and starves.  Put another way, Russia is already using its WMDs, while the West is reduced to brandishing pop guns.


Only way for the West to prevail is to give up its Permagrowth model and go 100% Green, Sustainable, Vegan, and Local. 


Cut consumption, kill the bear.


Plan A, B, and C: Don’t Feed The Bear


Sunday, March 27, 2022

What’s Wrong With These Pictures?

“This battle will not be won in days or months. We need to steel ourselves for a long fight ahead." US President Biden speaking in Poland March 26, 2022.

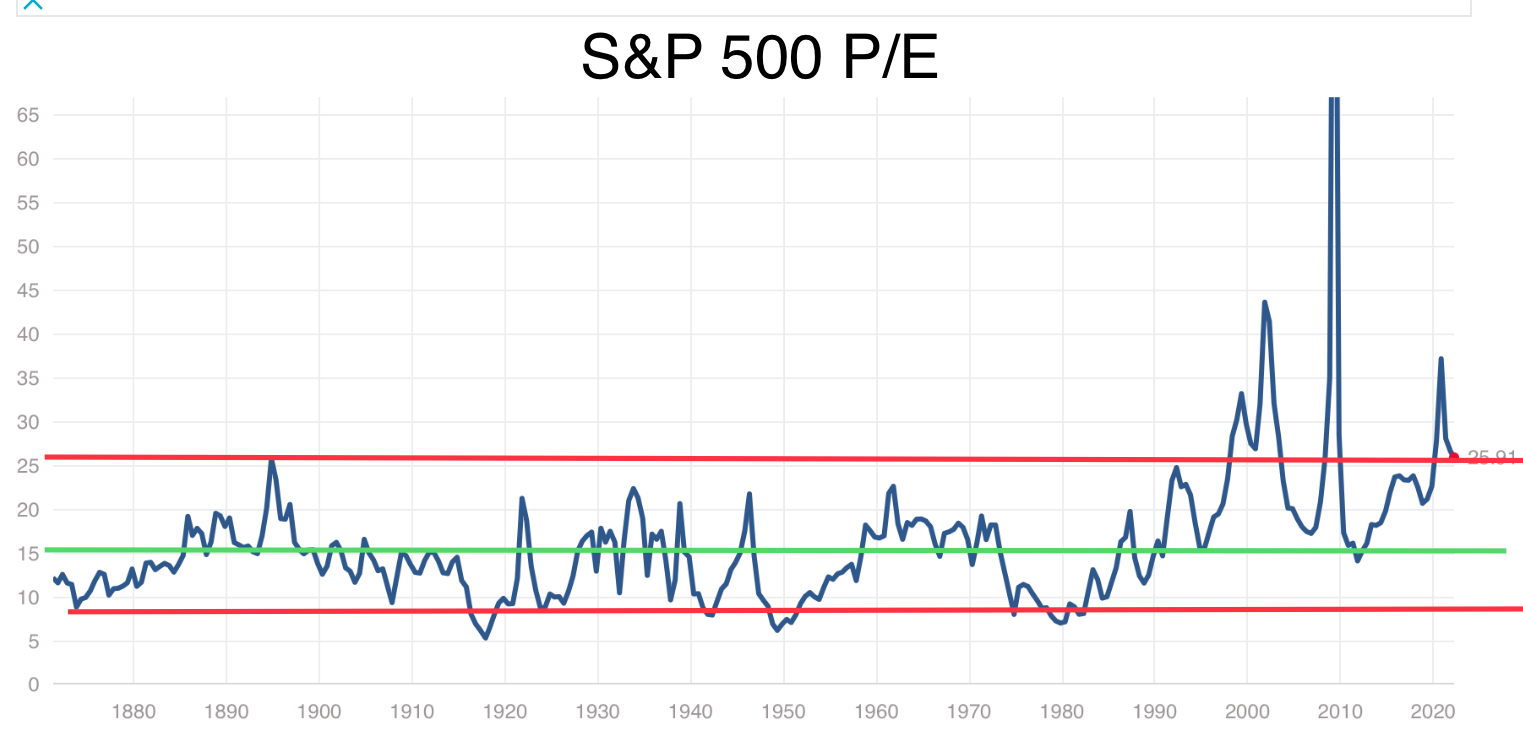
Now, look at the following charts. 

Then, ask yourself: are markets fairly priced vs. Mr. Biden’s statement?


Saturday, March 26, 2022

Yield Curve Warning

 One of the better predictors of recessions is the yield curve, especially when it inverts and/or flattens out very fast (ie when short term interest rates are higher or near long ones).  

An easy way to visualize this is the 10-2 year Treasury yield spread, see chart below.  Notice how the spread drops before recessions (in grey).  Will today be any different? Maybe - we didn’t get a recession in 1996-97, for example.


Another major difference after 2010 is the slow persistent decline culminating in 2019 right before the pandemic  - a period characterized by near zero inflation and very, very low interest rates, long and short. 

So, is there a recession in the cards? With inflation at 40+ year highs and interest rates still way below it, I don’t see how the Fed (and ECB) can avoid tightening further. Put it another way: the next recession may very well be a “punch bowl” type, where the Fed is forced to stop the party from getting out of hand. We haven’t had one of those in a very long time - I wouldn’t be surprised if younger readers don’t even know what I’m talking about 🙃🙃