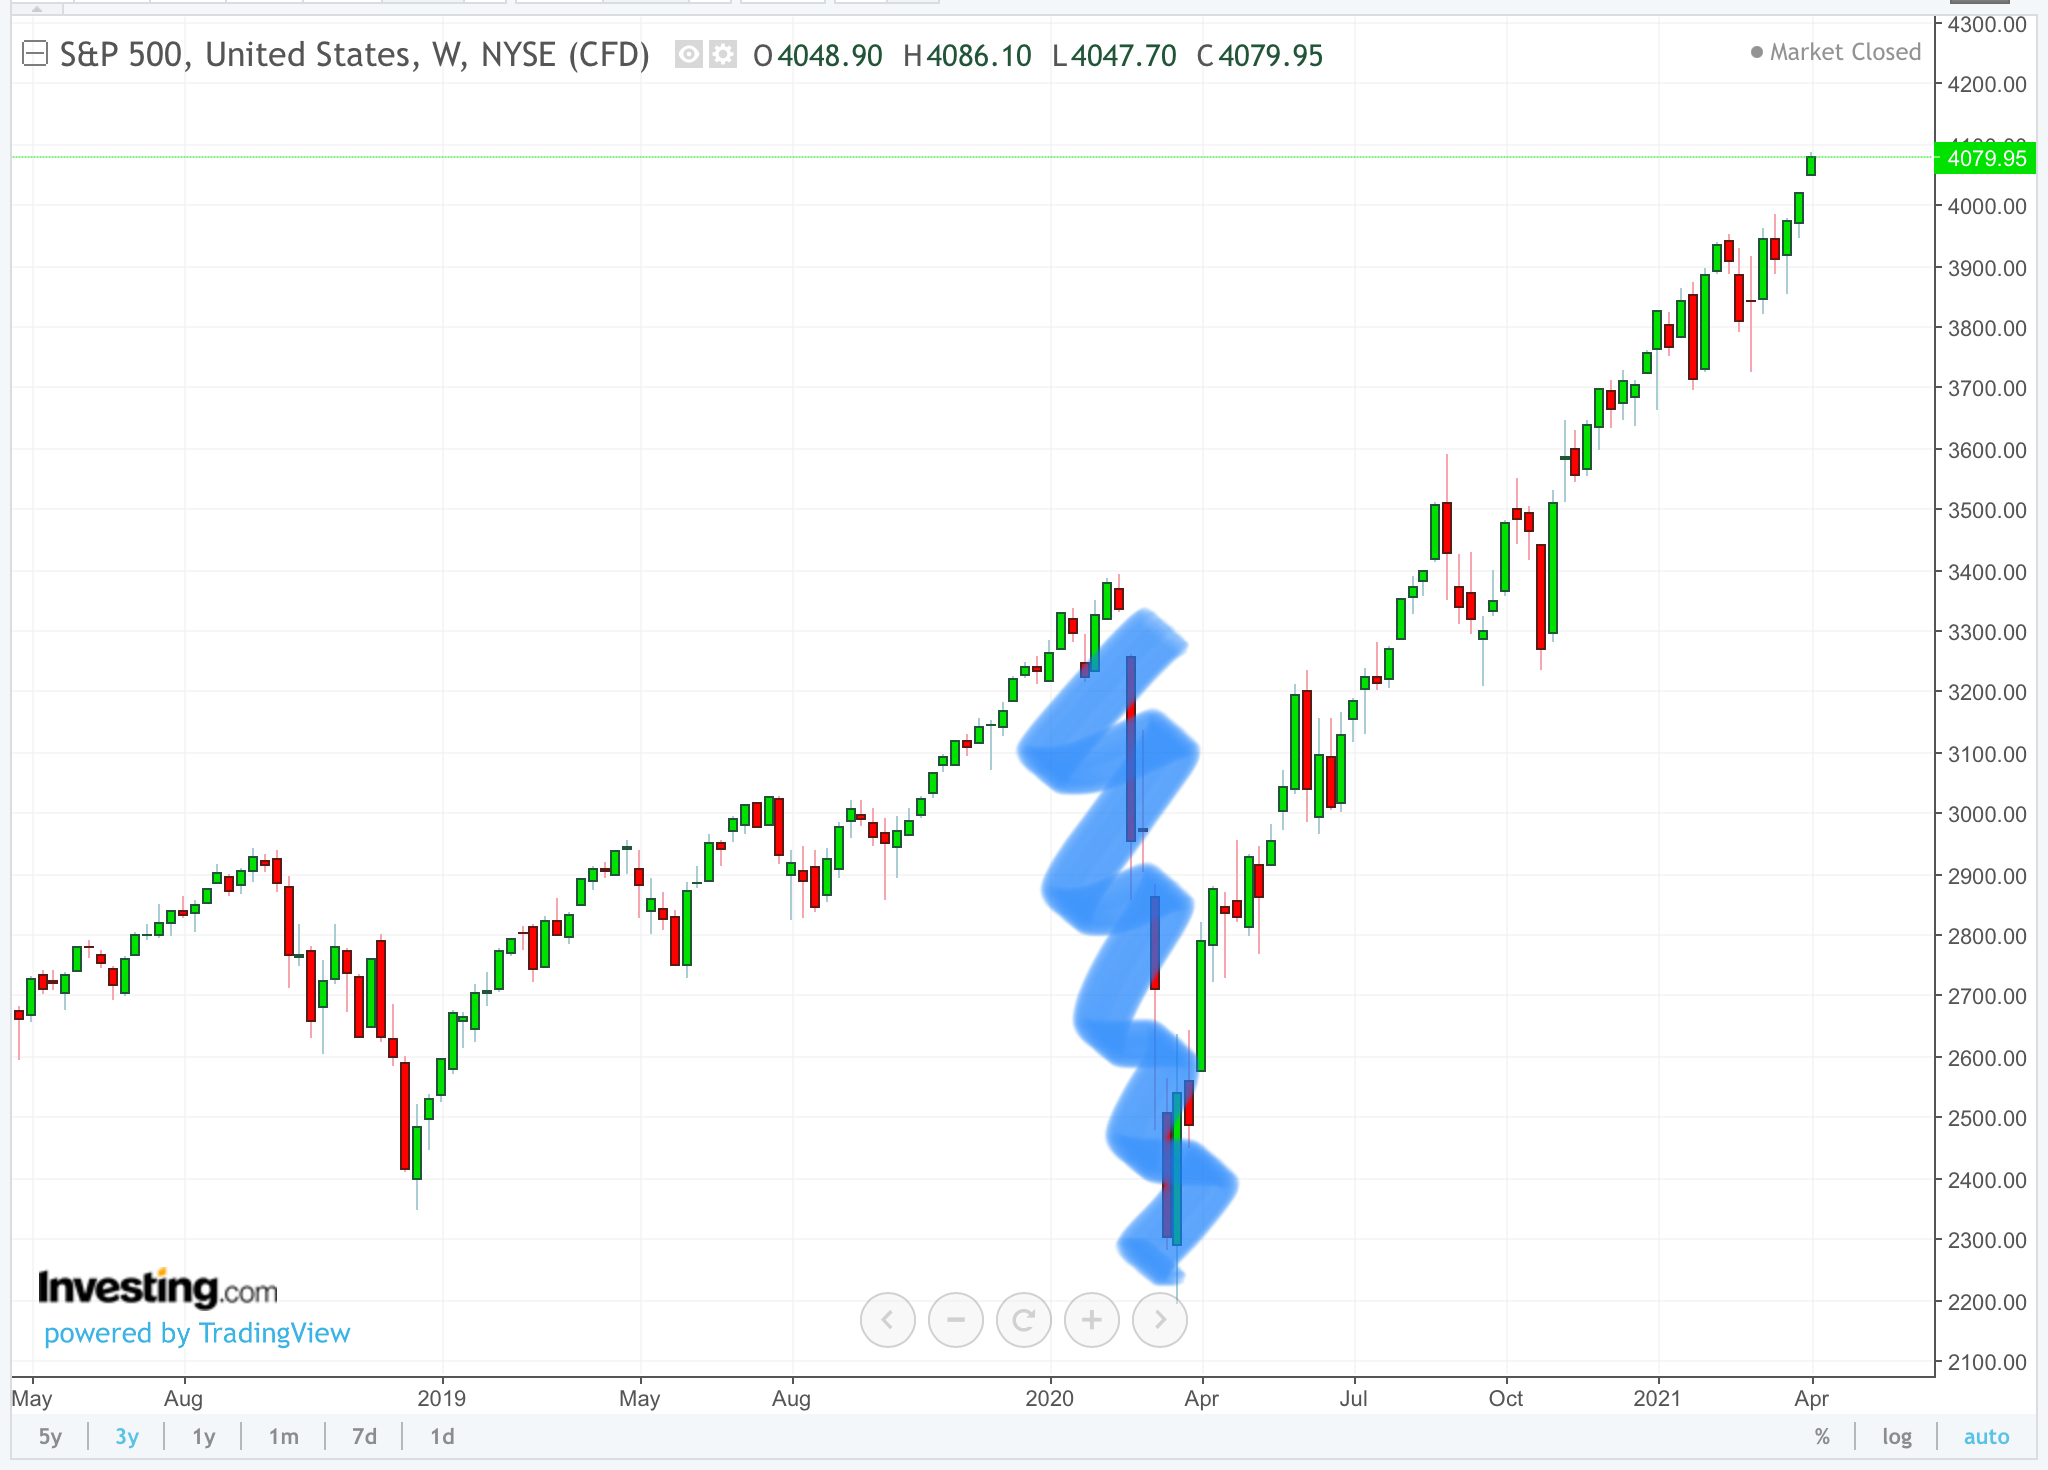
The US stock market is making new all time highs after bottoming out on March 23, 2020, when S&P 500 reached a low of 2200. The gain since then has been a whopping 86% in just over 12 months. How rare is that? In a word, extremely. Looking at the frequency distribution of rolling 12 month returns, such an event has occurred just about.... never!
Ok, but it’s a few days more than 12 months you say, and you are right. Looking at exactly 12 months since April 8, 2020 the return is “only” 49%, an occurrence with a frequency of a bit under 1% of the time. That’s once every 100+ years. (A bit like pandemics, eh?)

Let’s go ever further out on our assumption Matrix (pun intended) and say that last year’s big drop never happened, and pick up things from the previous high of 3370, pushing it forward to April 8, 2020. This will produce a 12 month gain of 21%, an event with a frequency of 13%, ie one out of every 8 years.
Of course, you can’t just take a big blue marker and wipe out the pandemic from history. Neither is an 86% gain a truly relevant statistic, since it happened from a deep, panic induced low. For my money, the frequency band that makes sense is between less than 1% and 13%. It’s like saying that today’s market is a lottery ticket with the odds of not losing being somewhere between 1% and 13%.
Ahhh, but that’s not why you buy a lottery ticket - you want to win! So, starting today you want to look at the next 12 months. Let’s say you will be satisfied with the median annual return of 8.79%. That will mean that the 24 month rolling gain will be 57.79% (49+8.79) - call it 58% for short. What are the odds of THAT?
Looking at the table below, the average 2 year return is 18%, far below your target of 58%. How far? I don’t have the raw data, but I’m willing to bet it’s a 3+ sigma event.
So, if you’re feeling lucky, and I mean REALLY lucky, by all means take the plunge... 😁😁

No comments:
Post a Comment