Sunday, October 31, 2021

China Enters Stagflation, EU To Follow Very Soon

 According to the latest statistics China is now at or very near stagflation. Industrial production has contracted for the third month in a row while inflation keeps ramping up. The US is (essentially) also in stagflation (see previous posts), while the EU is rapidly heading that way too. Add them up and you get almost 75% of the global GDP…

Unless inflation is stopped in its tracks right now we are in for a very rough time ahead.  With interest rates still extremely low, the real danger will be sovereign bankruptcies when long term bond rates spike up and investors refuse to buy/roll over more debt, even from the US.

The Fed and ECB are in denial, and so are most politicians.  Unlike them, all experienced, long term investors are constantly warning of serious trouble. One of my favorites is Jim Rogers who says the next bear market is just around the corner and will be the worst in his lifetime.

But hey, what does he know compared to the likes of Reddit users who are frothing in the mouth to trade yet another dog meme crypto? Yup, the world has gone mad.. woof woof…

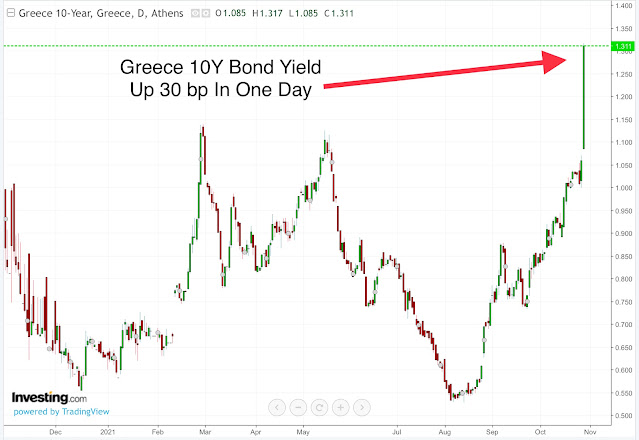
PS There is always a “canary in the coal mine”. In today’s bond market I think the dubious honor goes to the Greek Government 10 year bond (GGB).

Last Friday its yield soared by 30 bp (0.30%) from 1.00% to 1.30%. In ONE DAY… In terms of price in the secondary market, that’s a drop of  3 full points, ie a mark to market loss of 3%.  Think about it: a GGB investor lost in ONE DAY what he will make in interest in THREE YEARS.  


The Canary In The Coal Mine Looks Very Troubled


Saturday, October 30, 2021

Inflation Quickly Passing Through To Wages, Plus Beaujolais Nouveau

Yesterday’s report from the Bureau of Labor Statistics (BLS) showed that wage and salary costs in the private sector rose 1.6% for the three months ended in September.  That’s 6.55% annualized, the highest in at least 15 years- see below. When benefits are included, total compensation costs rose by 1.4% or 5.70% annualized.

But hey… let’s all keep chanting the Powell mantra:  “inflation is transitory”. I hear that burning incense may also help.


As luck would have it, yesterday also saw the Eurozone harmonized inflation hit 4.1%, the highest reading since 2008. Predictably, European bond markets had a fit, with 10 year German Bund yields jumping a 14 basis points from -0.20% two days ago to -0.06%. 

The highly indebted and “junky” periphery (aka Italy and Greece) fared even worse, with yields rising 25 and 30 bp respectively.  (1 basis point = 0.01%).

But hey, let’s all sip some seasonal Beaujolais Nouveau and toast Mme. Lagarde. Like incense, it doesn’t help but at least it makes you happy. Or very happy, depending on quantity. Salut..


Friday, October 29, 2021

Home Price Bubble - Again

 The Great Credit Bubble of 2006-08 was inextricably linked to the housing market, which saw prices spike to unsustainable levels. Credit became so widely available and cheap that house “flipping” became so common that even strippers in Florida got into the act. How about now?

Charts speak loudly.

1. House prices have spiked 20% in just one year


2. Houses are now just as unaffordable vs. income as at the top of the 2006-08 bubble.

3.  The reason is simple: the Fed has printed so much money and driven interest rates so low that mortgages are available for a song to anyone who can fog a mirror. Credit conditions are very loose AND interest rates are at record low.


Credit Conditions Very Easy 

ARM Mortgage Rates At Record Low 

Summing up: easy and cheap credit are sending house prices soaring.  BUT - and this is key - the fundamental measure of house pricing, the un-affordability of houses versus household income, is back to all time bubble highs. 

Record high prices, easy credit and near zero interest rates. Yes, we are in a house price bubble.


Thursday, October 28, 2021

3Q GDP - Even Worse Than It Looks

 GDP for 3Q21 was today reported as growing 2% (annualized), lower than expectations of 2.7%. Yet, the number was higher than the latest GDPNow estimate from the Atlanta Fed which was updated yesterday as 0.2%. That’s a pretty large error gap, right? Actually, it isn’t.

When inventory changes are subtracted the economy actually contracted by 0.05% - see below. Inventory numbers are notoriously inaccurate, so the FedNow estimate actually came in spot on, all things considered.

Analyzing a bit further, the government’s spending was erased by lower private fixed investment, while higher personal consumption was erased by the record trade deficit (negative net exports). We consumed more, but the increase was all made up of imported goods and services. 

Moreover, what actually happened with inventories is that they didn’t build up from the previous quarter, but instead were drawn down at a slower rate, thus producing a sort of “phantom” positive effect on GDP. 

Therefore, it looks to me that the US economy has stalled completely. With inflation at 5.4%, that’s stagflation..


Wednesday, October 27, 2021

PPI Begets CPI

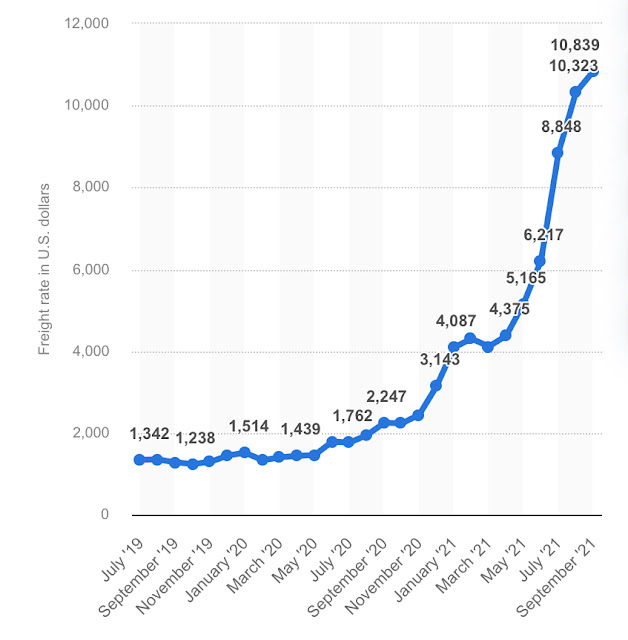
 Producer prices are rising at a rate not seen in half a century. That’s bad enough, but it’s  not even the whole story. Unlike 1970, 1980 and 2008, when the spike in the PPI index was mainly due to a very sharp increase in crude oil prices (anyone remember “Peak Oil”?), today it involves all commodities and all forms of energy inputs.  The rise is very, very broad-based and will impact every industry and every product. Add the phenomenal increase in shipping costs (up 800%) and our reliance on far away Chinese goods, and you have all the ingredients for a perfect inflation storm.

Looking at a chart of PPI and CPI and referring to the previous facts, I think it is difficult to conclude that CPI will be transitory and/or remain “only” at its current 5.4% level. Unless, of course, the Fed and ECB pull their heads from the QE sand and take action, right now. 


I fear that with their current ostrich-like behavior Powell and Lagarde are going to go down in history as the worst central bankers in history.  Unless they act… 

PS Charts of a broad based commodity index and a container shipping index are below..


Dow Jones Commodity Index 


Global Container Shipping Cost Index


Monday, October 25, 2021

Inflation And Money Supply (duh…)

 Aren’t you sick and tired of hearing that inflation is due to “temporary supply chain disruptions”? 

If you aren’t, may I respectfully suggest you apply for a Nobel Prize in Economics to throw out the one awarded to Milton Friedman for proclaiming (among other things) that “inflation is always and everywhere a monetary phenomenon in the sense that it is and can be produced only by a more rapid increase in the quantity of money than in output”.

But since I am myself sick and tired, and I most definitely do not claim a Nobel, here’s a graph that Mr. Friedman would agree with and shake his head: the change in nominal GDP and M3 money supply between 4Q2019 and 2Q21. - see below.


GDP (ie economic output) increased by $1.3 trillion versus an increase of $4.3 trillion in M3 money supply (ie the quantity of money) in the same time. This $3 trillion gap, approx. 13% of US GDP, is the real cause and enabler of inflation. Period, end of story.

It is highly probable that things got even worse in 3Q2021 because GDP growth slowed sharply (see previous posts on GDPNow) while the Fed has kept the printing presses running.

Inflation and money supply connected? Well, duh…. 


CPI Inflation Year Over Year 


Thursday, October 21, 2021

Our Dystopian Gilded Age

For a while now I have been thinking that we are living in a 21st Century dystopian version of the Gilded Age. Why dystopian? Because we get the Robber Barons, but not the rapid rise in workers' wages and higher living standards of the late 19th Century. Instead, we see the annihilation of America's once thriving middle class and its transformation into a Working Poor class. 

The dystopia is even more obvious during the pandemic, which has upended American society  to a degree only now becoming more noticeable. For example, people are quitting their jobs in record numbers and job openings are the highest ever.


 Sum Of Job Openings And Quits Hits An All Time Record

Doing a little more work with the data, I look at (Openings + Quits) as a percentage of the civilian labor force and compare them to the unemployment rate - see chart below

Job Openings + Quits As Percentage Of Labor Force (blue line) And Unemployment Rate (red)

 It is immediately apparent that openings and quits are much higher today than at other times when unemployment was similar as now - twice as high, in fact. It seems like the working class is revolting. Why?

Several academic researchers are rapidly amassing hard evidence that workers are no longer satisfied with the quality of their lives, no longer willing to work  for low pay and no flexibility, no or very few essential benefits like healthcare and vacation, no job satisfaction, no time off to create a family... in sum, to live and work in America as opposed to, say, Sweden or even Canada.  They are quitting and not going back to work quickly, not willing to accept just any job.

This "wooly" type of economic data, much closer to psychology than econometrics, is routinely ignored, and even thought of as nonsense, by Wall Street, central bankers and even politicians. Yet, it shouldn't. After all, the 2017 Nobel Prize in Economics went to Richard Thaler for his work on Behavioral Economics.. His seminal  Misbehaving: The Making of Behavioral Economics is a must read for all who still operate under the delusion that our species is homo economicus.

In his book Thaler recounts a research presentation he made to professors in the psychology department of the University of Chicago. They were all dumbfounded that their colleagues in the economics department completely ignored the very basics of human behavior when developing their economic models. The two departments never consulted each other. Amazing, isn’t it? 

Back to our version of the Gilded Age.

Our Robber Barons are getting more hubristic with each passing day, exhibiting behavior not seen since "Diamond" Jim Brady, Jay Gould, JP Morgan and the Vanderbilts.  Conspicuous consumption, space yacht competition, direct political influence, stunning disregard for the "common man", direct and indirect manipulation of markets (trading chat rooms, cryptos, meme stocks).


I am convinced that the current labor situation indicates a very deep level of popular dissatisfaction manifesting itself as a sort of workers' "flipping the finger" to the establishment. 

The original Gilded Age ended abruptly with the market Panic of 1899 and the election of reformist Teddy Roosevelt as President. Ours…?

Wednesday, October 20, 2021

Update: The US Economy Is Stalling Fast

The US economy is even closer to stagflation today.  

Following this week's weak numbers for Industrial Production and Housing Starts, the latest GDPNow update for 3Q2021 real GDP is at a mere 0.5% (annualized). The Atlanta Fed projection was at 6% as recently as August 27. 

Meanwhile, the mean Blue Chip consensus estimate stands (sleepwalking?) at 3.7%, with a range of 2.10% to 5.25%.

We know that inflation is very high with September CPI at 5.4%, so unless the Atlanta Fed estimate is grossly wrong, stagflation is no longer a possibility but a reality.


Bond Buyer's Arithmetic

 Very short post today. 

Should you buy bonds right now?

Inflation is at 5.4% and 3 year Treasury notes yield 0.723%.  

Let's accept the Fed's 400 PhDs prophecy (see previous post) which predicts that inflation will dip back to 2% in 2022 and out. Further, let's assume that inflation has already peaked and that for the rest of this year (3 months left) it will average 4% annualized.

So, during the next 3 years your money will lose purchasing power as follows:

Rest of 2021: 1%

2022: 2%

2023: 2% 

9 months 2024: 1.5%

Total for 3 years: 6.5% (ignoring compounding)  

If you buy the 3 year Treasury note right now you will make 3x0.723% = 2.17% in interest.

Thus you make      2.17% - 6.50% = -4.33% a negative real return 

Should you buy the 3 year Treasury note, even if you believe the Fed's 400 inflation projections? 

  1. Yes, but only if you believe there is an imminent economic collapse which will result in massive deflation. 
  2. No, you're not a fool to give money away.

In case #2, what interest do you want to receive TODAY as a minimum per year just to break even? Easy arithmetic: 6.5%/3 = a little over 2.1% 

Looking at the chart of the 3 year Treasury yield...


The corollary is that the Fed's constant manipulation of the bond market through QE has created a Catch-22 situation, where we either go into a deep deflationary recession or allow interest rates to rise very significantly above current levels, also likely creating a recession through a bubble collapse.

Welcome to Modern Economics. 

PS... remember the "soft landing" meme back in 2006? I'm willing to bet that's exactly what the Fed and Treasury are hoping for today as well.  How did that work out in the past, eh?


Tuesday, October 19, 2021

The Fed Goes Delphic

Forecasting is ancient business. The Greeks, for example, had several oracles who provided godly prophecies in exchange for cash and gifts. Business was particularly brisk in Delphi, where Pythia sat on her tripod in a fume-induced trance to produce the ancient world’s most famous and prestigious omens. A whole rich town developed around her, complete with huge temples to Apollo, a big theater, a stadium and, yes, banks (they were called thesaurus - Treasuries).

The Thesaurus (Treasury) Of Athens In Delphi

Like all prophecies, hers involved both art and science. A team of experts (Apollo’s priests) carefully weighed who asked what before “interpreting” Pythia’s conveniently incomprehensible mutterings for the paying customer. The priests were sophisticated professionals, very up to date on global political, military and financial affairs, since clients came from all over the known world. Meaning, the resulting "prophecy" had everything to do with who and when asked for it.

A Delphic prophecy was highly sought after because it provided a kind of official public endorsement: for example, a king was not likely to go to war without first consulting Pythia. It then became a matter of cash-lubricated geopolitical negotiation to obtain the most propitious omen.

Did oracles make mistakes? Never! If the priests found themselves in a bind between conflicting interests, they would use the famously contorted ancient Greek grammar and syntax to compose completely ambiguous omens.  Or, if they did actually make a (rare) mistake in their original assessment, they would resort to Apollo: the customer must have somehow offended the god after the omen was tendered, so the prophecy became null and void.

Enough with ancient history..

Today I got my regular morning e-mailed update from Bloomberg.  On top was an article proclaiming that "the Fed's army of more than 400  PhD economists has a message on inflation for policy makers and the American public: Chill out."  They expect inflation to fall back under 2% in 2022 and claim that their track record is better than Wall Street's or other private forecasters. 

I don't know if they are right longer term, but a year ago the same Fed staff PhDs were anticipating a rise in inflation from 1.3%, but nowhere near today's 5.4% (their consensus was around 1.7%). Therefore, the relevant question to ask of the 400 priests... errr, economists... is this: why was your prediction so very wrong?

This is my opinion on the matter: 

Forecasting is 99% looking at the past and casting it forward, expecting it to repeat. This usually works pretty well, particularly if you possess the mountains of raw data and computing power of the Fed (those 400 PhDs...).   We call the process Econometric, the ancient Greeks called it Delphic. 

But if the econometric formula itself is only validated for a certain limited time period in the past,  when the economy did not exhibit big fundamental shifts, the data will go in and produce erroneous, or possibly disastrous, results (omens).  We have already lived through exactly such an event with the collapse of the Great Credit Bubble in 2008.  

In that case, all the mortgage securitizarion, tranching  and credit derivatives were based on a formula that was validated only back 30-40 years, when mortgage defaults never exceeded 3-4% at most. It presumed this would also hold in the future, with disastrous results. Had the financial engineers gone back and included default data from the 1930's this would have never happened.

Today's forecasters may be making the same mistake by failing to take into account how interconnected today's global economy truly is. By not tweaking their formulas to calculate the effects of just-in-time commerce on consumer prices or, perhaps even more importantly, the Fed's own unprecedented cash deluge, which may result in asymmetric, even exponential inflationary effects.

Or, it may just be that the priests do not want to upset the paying customer who insists on 2% or less..


Monday, October 18, 2021

Flipping Bonds… Or Burgers?

The following is an excerpt nefariously purloined from the daily digital diary of Bubba Bondaddy, a bond trader at one of  Wall Street’s major bond dealers.

Tuesday Oct. 12, 2021

Woke up early and anxious.  A new 3 year Treasury note is being auctioned today, and I really, really don't want to buy any. To be honest, I don't even wanna bid!

Inflation is picking up and the Fed is gonna have to start tapering its  QE and raising interest rates soon. Yeah, Powell keeps saying inflation is transitory but, man, it sure feels mighty sticky lately.

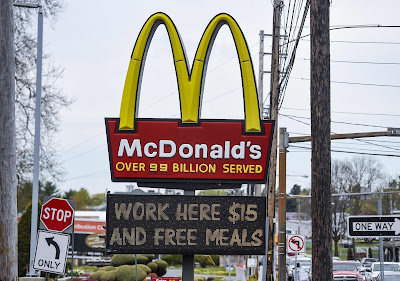
I mean, jeez, natural gas prices in Europe are zooming, coal in China is zooming... who woulda thought that I would give a fig about coal in China, huh? It's a brave new world out there, fershure. And at home, I drive by all those fast food joints begging for people to flip burgers at $15/hr…it ain’t natural, man.


Anyway, I am obliged to bid because I work at Smith Harris Smythe & Co. who is a primary dealer. When you gotta bid, you gotta bid....

...... Well, I did bid and got a bunch of the 3 year paper at 0.635%. Boy, was I surprised  because the 3 year traded at 0.560% yesterday, so I bid low on purpose (NB meaning at a higher yield)  - and I still got filled 7.5 basis points higher! Damn, they must have scraped the bottom of the barrel to get this baby sold. Oh well, it's only a 3 year, how bad can it get? 

Seriously, though, I don't feel good about holding all this paper on my book.

Wednesday Oct. 13, 2021

Dammit, wouldn't you know it? Inflation numbers came in today, worse than expected. Headline CPI at 5.4% year over year - last month it was at 5.3%. The coneheads in analysis were calling for 5.3% again - but you know how they play the game... They call for a "safe" number expecting  the actual will come in better and thus "beat" the expectation to produce a rally.  Well, duh, it came in worse! 

So now what? The 3 year immediately jumped to 0.684% following the bad inflation numbers, meaning I get hit with a mark to market loss of  14 ticks on the price (NB from 100.00 to 99.86) -  in just one effing day!!

If there is one thing I hate most of all is to buy into an auction on Tuesday and start losing money on Wednesday!! In just 24 hours I'm losing in mark to market what I will earn in interest in almost three months! 

Monday, Oct. 18, 2021

I’m getting killed this morning. The 3 year is at 0.760%, almost 13 basis points higher. I’m losing  40 ticks in price on my  mark to market - in less than a week. On a friggin’ 3 year!!


Three Year Treasury Note Yield

The way this is going my bonus is gonna be toast this year and I might as well start flipping burgers… aaaarghhhh.


Sunday, October 17, 2021

Wages And Inflation

Real, inflation adjusted wages in the US have been stagnant for decades, particularly for men. (The spike up during COVID is explained by the mass layoffs of  workers in the low-pay service industries like hotels, restaurants, etc. which brought up the average of those employed.) Even so, median wages are at the same level as 1979!


Is this about to change significantly? Perhaps yes. 

Job openings (ie demand for labor) are at historic highs, while the number of people quitting their jobs (a measure of shrinking labor supply) is also at an all time high.


Data From Latest JOLTS Release Point To Significantly Higher Wages Soon 

As with anything else, higher demand plus lower supply equals higher prices, in this case higher wages. But wages, unlike commodity prices, are “sticky” on the upside - you can’t have people working side by side doing the same job but getting paid different wages. That’s why we say that inflation gets “baked in” when it passes through to labor costs.

What is going on in China is another reason to expect, indirectly, higher US labor costs. Cheap imports were driven mainly by extremely low Chinese wages (“one bowl of rice”). That’s clearly over now:  Xi Jingping’s brand new “Common Prosperity” policy means living standards must rise for the working class, paid for by higher wages.  No longer will US employers be able to “import” China’s cheap labor, providing American workers with greater wage bargaining power.

Bottom line: inflation is not going away soon.


Saturday, October 16, 2021

Stagflation Arrives To America

 The following chart shows the GDPNow estimate for 3Q2021 real GDP (annualized) now at 1.3% vs CPI inflation at 5.4% for September. I remind readers that GDPNow is an algorithmic estimate for the most current, upcoming GDP number. It is produced by the Atlanta Fed without using any economists’ “guesstimates” or, even worse, biases - political or otherwise.

GDPNow Growth Estimate Way Below Inflation

Assuming the GDPNow estimate proves accurate (a pretty good assumption given its excellent track record), the chart shows that stagflation has arrived to the US - and in spades.

Next stop in the stagflation process? Rising labor costs, now growing at the fastest rate in 20 years - see below, another helpful interactive data service from the Atlanta Fed.   And once inflation passes into wages it gets pretty much “baked in”. 


It looks increasingly certain that inflation is not transitory and that stagflation is upon us, despite Mr. Powell’s dictums.The question now is, how long will will the unwelcome guest stay? 

IMHO, for as long as Fed and Treasury keep stocking the buffet with QE and zero interest rates, stagflation will be with us for the duration. 


Friday, October 15, 2021

October Surprise?

The Atlanta Fed has a mathematical model to estimate GDP on a running basis. It’s called GDPNow, and this is how it is described:

GDPNow is a nowcasting model for gross domestic product (GDP) growth that synthesizes the bridge equation approach relating GDP subcomponents to monthly source data with factor model and Bayesian vector autoregression approaches.

Good luck with that explanation if you do not have a degree in statistics. But you don’t need one if all you care about is its forecasting accuracy.

The current GDPNow forecast for 3Q2021 real GDP growth is just 1.3% annualized, way below the 6.5% expected by “blue chip” economists - see chart below.  This high number is what Wall Street is betting on as well, given the heroic equity P/Es. It is interesting to observe that GDPNow was also projecting a little over 6% growth as recently as late August, and then declined sharply within weeks.

This is the detailed evolution of the GDPNow estimate:


So, just how accurate is the forecast? Excluding the COVID quarters which witnessed huge statistical volatility, the GDPNow model is very accurate, particularly nearer the release of the official GDP numbers - see chart.


The Bureau of Economic Analysis will release its estimate for 3Q21 GDP on Oct. 28, just 13 days from today. Given the GDPNow track record above, it is highly unlikely that it will err by more than 0.5%-1% in either direction, thus producing an October surprise.

Wednesday, October 13, 2021

Individual Folly

 Global equity markets… well, basically it all boils down to the US stock market.. have exploded upwards during the pandemic as the Treasury and Fed unleashed a torrent of fresh cash (ie debt), upwards of $5 trillion in less than 2 years. 

Where did the money go? Stocks, real estate, cryptos and loony-price NFTs.

Who did the buying? Individuals, many of them young first timers who “know better” and scorn all professionals.

Here are two eye-popping charts from the Financial Times.


First observation: all this money came in during the first half of 2021. Since then, equity markets made new highs, but then reversed and are now back neat the levels reached at the end of the first half.


What does this mean, in my opinion? There is likely a “rotation” going on, typical of all late stage bull markets: stocks are being increasingly sold by “smart” money holders and being bought by retail investors/speculators.

Second observation: on the S&P chart above, what does the price pattern look like to you? All comments encouraged. 

Third observation: the majority of investing in stocks these days has almost nothing to do with individual stock picking;  instead, it is almost entirely ruled by passive indexing.  Apart from meme stocks (which aren't many, anyway), retail investors buy broad index funds and then "forget" everything else. It's like using a "smart" weapon in FAF mode: fire and forget, trust the electronics to find the target.

I'm not sure how successful this strategy will be during a prolonged bear market or, even worse, if it could precipitate or accelerate a crash.  If an investor ONLY looks at a single number all the time (eg S&P 500) to the exclusion of EVERYTHING else like earnings, dividends, corporate news, valuation metrics, balance sheet data... wouldn't that make him/her more likely to jump when the trend changes instead of being patient? And what would happen when/if everyone wants to jump at the same time?


Tuesday, October 12, 2021

How Much Is Left In The Till?

"Countries don't go bankrupt" was an infamous riposte by Citibank Chairman Walter Wriston (1967-1984).  He was proven disastrously wrong, particularly in Latin America.

 Aaaah... bankrupcy... how does it happen? Well, for countries it's the same as for businesses, a matter of how many australs, pesos or dollars you have in the till against your current bills. Solvency vs. Insolvency. 

Business analysts routinely calculate the Acid Ratio: Current assets (mostly cash and equivalents) divided by current liabilities. Anything less than 1.0 and you are close to being toast. How's the US doing? In a word, terrible. 

Last month the debt limit was reached and no more borrowing was possible. The country was speeding headlong towards insolvency, until Republicans relented and offered a very limited short term "solution" to fund the government only until early December. Think dam, Dutch boy and finger.

The US has been running budget deficits for decades, constantly raising its debt load and requiring one debt limit extension after another. In the past, such political decisions were pretty routine affairs, even if they involved grandstanding in Congress.  No more - the deficit has exploded to third world levels at the exact same time when political rivalry is at its most intense.  The budget chasm is as big as the chasm between Republicans and Democrats - see chart below.

Federal Current Expenses (red line) And Current Revenues (blue line)

Deficits for FY2020 and FY2021 reached $3.13 trillion and $3.67 trillion. These are truly staggering figures, translating to 15% and 16% of GDP respectively.  (For reference, Greece reached similar percentages in 2010 and was forced into bankruptcy.) 

Fiscal 2022 is expected to be better with a deficit of "just" $1.84 trillion, around 7-8% of GDP. That's assuming, of course, that Congress will agree to raise the debt limit before December.

So, how solvent is the US, what is its Acid Ratio? First, a chart of the the Treasury's balance at its "checking" account at the Fed.  The account zoomed to $1.8 trillion as the Treasury borrowed record amounts during the pandemic, and then dropped just as fast as the money was disbursed far and wide. As of last Wednesday it stood at $96 billion.

 US Treasury General Account At The Fed And Days Of Deficit Cover

It may seem like a lot of money, but the government currently runs a monthly deficit of $171 billion (as of August), so $96 billion covers (covered..) only 16 days of operations. That's mighty tight, by any measure - a 30 day acid ratio of just 0.56x.  Compare this with 135 days just prior to the pandemic (4.5x) and 207 days at the top (6.9x).

Are we toast yet?

Congress just passed the stopgap bill which will provide the Treasury with increased borrowing authority (and thus extra cash through T-Bill sales) until early December. It should bring the acid ratio back up to around 2-2.5x as of this week - but then what? Since this is a very limited borrowing authority, the cash will immediately start to drain again without replenishment. Unless the debt limit is raised significantly by December, the US will once again skirt with insolvency. 

How in God's good name did the US reach this point? 

Is this the way a global Empire should be run, and is it therefore really entitled to a AAA/AA+ rating? Unless the government/Congress gets its act together fast by raising revenue and cutting expenses it will soon lose the faith of markets. Global investors will spurn Treasurys and then... bye bye Empire. The till is empty - the United States cannot keep acting as if massive deficits are an entitlement. American exceptionalism can only go so far.

It is time for America to bite the bullet and make hard decisions.


PS  In yet another sign that the political chasm is immense, Republican Texas Governor Greg Abbott yesterday issued an executive order banning all COVID vaccine mandates. This means that companies such as American Airlines, Facebook, Google, etc cannot require proof of vaccination for their workers in Texas and cannot fire them if they do not comply. 

 If America's political leaders cannot agree on something as scientifically straightforward as vaccination, using it instead for political gamesmanship by risking the very lives of their citizens, what is likely to happen with the debt ceiling in two months?

Monday, October 11, 2021

Best Article On Current US Politics

The following is an article by Gerard Araud, the former Ambassador of France to the US (2014-19). It was published in Le Point yesterday. 

It is by very far the most precise and cogent description of current US politics that I have seen. While the author does not offer any conclusions, I think we can all form our own quite easily.

============

The Misfortunes Of Joe Biden

Americans are proud of their institutions.  They see in their Constitution, which has been in force since 1787, a perfect balance between the federal government and the 50 states that make it up, as well as between individual rights and the laws of the state.  Maintaining this balance presupposes the cooperation of the legislative and executive branches of government.  Thus, the White House needs Congress to act, but within Congress itself they have introduced procedures so that the majority cannot impose its will on the minority.

American political life presupposes consensus and agreement, either between the President and the elected representatives, or between Republicans and Democrats.  Until recently, the system worked well as the two parties each covered a very wide range of views and always had members willing to compromise with the other side.  A Democratic president could therefore work with a Republican Congress and vice versa.


This is no longer the case. The Republican Party has become radicalized under the pressure of its base.  A new generation of party leaders is absorbing the moderate candidates in favor of the "hardliners" who refuse to cooperate with the hated Democrats.  The conservative Democrats of the South and the moderate Republicans of the Northeast states who bridged the differences between the two parties have disappeared.  Now the electoral map consists of fiefs of one or the other party without possibilities of cooperation.  Out of the 435 constituencies for Congress only 78 are politically ambiguous.  Essentially, two countries are now facing each other with increasingly rare intermediaries.


Barack Obama was the first to face this new reality when he lost the majority in Congress in 2010 and, despite his moderation, faced an uncompromising opposition determined to paralyze his actions.  Trump's election led to another radicalization, that of the Democrats, who never stopped questioning his legitimacy, while for his part, Trump made sure to add fuel to the fire of his camp's passions.  Biden, the personification of moderation, has therefore inherited a divisive country where it is becoming increasingly difficult to operate institutions designed for collaboration and consensus.  The more time passes, the more it seems that his constant calls for reconciliation fall into the void.  The House of Representatives Republicans, the majority of whom have not recognized his victory, and the Senate Republicans, who are afraid of suffering Trump's wrath, offer him no relief.  As if that were not enough, now the biggest difficulties come from within his own camp.


The Democratic Party is divided between moderates and progressives.  The latter did not like at all the compromise that Biden negotiated with a few Republicans for an infrastructure plan which they find inadequate.  So they refuse to vote for it unless at least social measures are added on a scale that the two more moderate Democratic senators refuse to accept.  The impasse in the President's own camp seems insurmountable.  In the Senate, the Left sometimes joins Republicans to block people considered too moderate from assuming positions in the administration


Democrats are also divided at their base.  Woke ideology triumphs in universities but also often in local party delegations.  Many Democrat voters believe that the party is in the process of "suicide", and white suburbanites will hardly vote for Democrats again while they present this picture.


All of this paints a picture of despair for Joe Biden who is collapsing in the polls.  Public opinion has not appreciated either the devastation in Afghanistan or the impasses that have been created in Congress and the Senate.  Nothing is lost yet, but he will need all of the negotiation skills he possesses in order to make it through Scylla and Charybdis.  On the one hand, the fanatical Republicans loyal to Trump and on the other, the hysterical leftists of the Democratic Party.


  Gerard Araud

  Former Ambassador of France to USA (2014-2019)


  Le Point, Oct. 10, 2021

Saturday, October 9, 2021

More Bond Tea Leaves

One chart in the "reading the tea leaves" technical analysis category.

The chart for 10 Year US Treasury futures has formed a pattern known as a Head and Shoulders.  In technical mumbo jumbo is is considered the most powerful reversal pattern, particularly if it is confirmed by other indicators such as trading volume, Relative Strength, etc.  

With head and shoulders it is also very important not to jump the gun, ie one must wait for prices to cross the neckline decisively. Once a break is confirmed, technical theory says that prices will move at least as much as the height of the head above the neckline.


Assuming a decisive break has occurred (a big IF in the chart above) the target "reads" to a price around 120, a level last seen in November 2018, well before COVID and massive MMT-driven QE. 

For reference, the current 10 year yield is at 1.61% vs. 3.00% in 2018 and the latest CPI inflation reading (Aug. 2021) at 5.2% year-over-year vs. 2.20% in November 2018.

The case for bond yields at these low levels, much lower than headline inflation, rests entirely on the premise that inflation will revert to 2% very, very soon. Given what is happening with energy, commodity and transportation prices globally, this premise is rapidly turning into wishful thinking, 

 Dow Jones/S&P Global Commodity Index Highest In 12 Years

Doing paper napkin economics the 10 year should be yielding 5.20+0.80 = 6.00% .. it's totally far fetched, of course... but 3.00% seems rather logical - to me, anyway.

As always, these posts ARE NOT INVESTMENT, TRADING, SPECULATION OR ANY OTHER KIND OF ADVICE. It's merely me, myself and I talking to my rubber ducky.

Enjoy the long US weekend!


Friday, October 8, 2021

Risk Of US Default Rises

The Senate passed a stopgap measure last night to fund the government until around December 3. Did this improve or worsen the US credit profile? In my opinion, it made things worse.

Sure, the agreement averted an imminent default on Oct. 18.  But...

  • It is obvious that the US government and political system is in deep trouble. Things should never have reached this point of funding the country on a day-to-day basis, not for a AAA/AA+ rated sovereign, anyway.
  •  The debt limit process has to start anew and conclude in 6-7 weeks. The can was just kicked down the street a few feet (meters), the serious problem remains.
  • The stakes have been raised by the Republicans, who will now demand complete "surrender" on the Biden plan to spend $3.5 trillion.
  • The stakes have also been raised by the "progressive" faction of the Democrats who will accept nothing less than the $3.5 trillion.
  • Therefore, the probability of total political gridlock going forward is now higher than before.
  • Therefore, the risk of default - small though it may be - is higher today than yesterday. 
  •  Markets seem to agree: US sovereign Credit Default Swaps rose to 17.4, the highest level in one year, and the country dropped further to number 12 as a credit risk. 
  • The US is now almost twice as likely to default as Germany (0.29% vs 0.15%)


I will repeat my point of several posts ago: the US CDS are mispriced and we should now be using Germany as a benchmark for their proper calculation.  Following the methodology of my post produces a theoretical US CDS price of 134. That's a level almost 8 times higher than now.

And, I will say it again: it is the "unthinkable" that we must worry about and protect against.

Thursday, October 7, 2021

Raising The Debt Limit - What's It To Me?

Sometimes politicians make the stupidest mistakes and their actions reveal much more than their words.

So, Biden goes on TV to push for raising the US debt limit. To deliver this very, very urgent and important message, he asks some important people to help him drive the point home. Here’s who he invited:
 
The CEOs of:
 
1. Bank of America
2. Citibank
3. JP Morgan
4. NASDAQ
5. Deloitte
6. The National Association of Realtors
7. Raytheon (94% of its revenue comes from defense contracts)
8. Intel
 
and the head of
 
9. The American Association of Retired Persons


Thus:
  • Five out of nine are financiers 100% dependent on debt
  • One is the head of a defense contractor whose revenue depends entirely on funding (debt) decisions made by politicians.
  • One heads an industry that depends on ever more debt to finance ever more expensive homes.
  • One - just one - heads a true American tech champion
  • And, finally, one represents people who will really suffer from a government shutdown, if their Social Security payments are delayed

So, how is the typical middle class Mr. and Mrs. John Q. Public taxpayer, in whose name the already huge public debt will be raised even further, supposed to identify with those people and their institutions?  Why should they care? To fund the banks, the realtors and the defense industry?

Oh, and Biden is a Democrat, a member of the party that champions the working class - supposedly. Sometimes the truth is there in plain sight, on prime time TV...

But since this is a data driven blog, let’s look at numbers.

The 2022 US budget projects revenue of $6.01 trillion and deficit of $1.84 trillion,  ie this is what needs to be covered by more debt, ie an equal rise to the debt limit. If we decided NOT to raise debt, we must cut outlays and raise revenue by a combined $1.84 trillion. 

Here are some expenses we should not cut, in billion dollars

  • Interest on existing debt (must not default): 305
  • Social security, income security, Medicare: 2960
  • ===> Total untouchable: 3265
This leaves 6010 - 3265 = 2745 in all other expenses, (the largest is defense at 770 billion).

Given that we need to come up with 1840 to balance the budget, it is obvious that we can’t do it just by cutting these other expenses alone. So, here’s a novel (not) idea:

Cut defense by 50%: 385 billion - we are not at war and shouldn’t be the planet’s policeman, either
Cut everything else 25%: 690 billion
Total savings 1075. Still need another 765 billion ====> increase income and wealth taxes by that.  
Done.

Or, here’s another “radical” idea: the US burns through 500 million gallons of gasoline and aviation fuel per day! Tax it like the rest of the civilized world at $2.00 per gallon and you raise $365 billion per year. And gasoline would still be half the price than in Europe!!   

Sure, consumption will go down, but that’s what we need, no?


Wednesday, October 6, 2021

Some Bond Yield Levels To Look Out For

 In yesterday's post I wrote that the bond bull market is the longest and most significant in financial history. Yields on 10-year Treasury bonds have been dropping steadily from 10.50% in 1985 to 0.50% last year's pandemic low. They are at 1.57% right now.  

What could signal the end of this run? 

  • On a fundamental basis, it is already happening. We don't have to do fancy analysis: inflation is at 5.2% and the 10-year Treasury is yielding only 1.50%. Adjusted for inflation, bond investors are losing 3.70% every year - obviously, this cannot go on for long.The last time inflation was at 5% the bond yield was at 4% - see below.

CPI Inflation And Yields On 10-Year Treasury Bonds

  • On a technical basis (ie looking at chart patterns), yields are very close to breaching a technical resistance/reversal level on the upside. On the chart below, it's the lowest thin red line, a "neckline" for an upside head and shoulders pattern. Right now, that level is at 1.65-1.70%, and if it is breached decisively on the upside it "reads" to 3.00% (thick solid red line). But, at the 3% level the very long term channel will also be breached, so I would not be surprised to see rates go to the next resistance at  5.00-5.50% (dotted red line). And guess what? - that's where inflation is today.

 Ten Year Treasury Yield - Annotated With Technical Resistance Levels

  • All of the above is equivalent to reading tea leaves or consulting the oracle of Delphi  What is more significant, in my opinion, is that we cannot continue to run monetary policy on hope alone, hope that inflation will quickly subside back to 1.5-2.0%.  We need to face facts right now and act accordingly, before it is too late.
  • It's not like we haven't seen this before. A massive spike in energy prices in 1973 created a vicious cycle of consumer price and wage increases that lasted over a decade and eventually required extremely painful medicine to reverse, with short term rates soaring to 20%.

 Inflation And Fed Funds In The 1970s And 1980s  

  • One final remark, again on China-US relations. The tide has turned, we are no longer partners with mutual economic interests, but rapidly diverging adversaries. Do not - NOT - expect China to do us any favors. It will not keep buying ever more US bonds: they are already net sellers, despite ongoing huge trade deficits.  According to the US Treasury/Fed, China's holdings of Treasurys this July were $1.295 trillion vs $1.318 trillion in January (both including Hong Kong).  That's not a big drop, but consider that in the same time the merchandise trade deficit reached $187 billion. If anything, China's Treasury holdings should have increased, not gone down
Inflation is rising rapidly, bonds are at big negative real yields because of the Fed's daily manipulation (QE), and China is getting seriously antagonistic. Watch those tea leaf yield levels: 1.65-70%, 3.00% and 5.00%.  

Tuesday, October 5, 2021

The Biggest Bull Market In History

What is the biggest, longest and most significant bull market in the history of finance? No, it isn't stocks, gold, oil or whatever else. 

It's bonds - see below.


Yield On 10 Year Treasury Bonds

Yields on 10-year Treasury bonds have been coming down for 37 years, staying inside a very well defined channel from 10.50% in 1985 to 0.50% just last year.

At the same time, federal debt has increased from 44% to 125% of GDP. - see below.

US Federal Debt As Percentage Of GDP

Despite the massive increase in debt, interest rates were going down even faster. Therefore, the cost of servicing the debt dropped from 3.2% of GDP in 1990 to 1.2% in 2015 - see below. 

 Interest Cost On Federal Debt As Percentage Of GDP

However,  interest outlays have been rising sharply since 2015 despite record low interest rates.  Even with near zero rates during 2020, interest costs were at 1.65% of GDP.

Low interest rates have allowed the US economy to constantly borrow and spend excessively without much thought for the future. That's why I called the bull market in bonds the most significant in history - it is ultimately undermining American global preeminence.

During the Reagan years (1980-88) the rise in federal debt was constantly in the news. There was even a "debt clock" in New York's Times Square with numbers changing in a blur. Everyone was anxious about it - and it was at less than 50% of GDP!!  Today, it seems that everyone has forgotten it, throwing trillions around as if they were penny candy. Well, they aren't.

Today's meme is that debt doesn't matter because debt service costs are so very low and we can easily afford them. Yes, for as long as the bond market rally continues this is true - more or less. Rather less, actually, since 2015, as we see from the last chart.

Can interest rates go much lower or even turn negative, as in the eurozone?  I can't really see how they can in the US, barring a total economic collapse with thousands of corporate bankruptcies and debt write-offs. Two reasons:

  1. The Fed has been buying $120 billion of bonds per month, yet long term interest rates are rising.
  2. Inflation is going up at the fastest pace in decades. It’s all temporary say Fed and Treasury, but it feels more permanent with every passing day.

Thus, the trillion dollar question: Is the longest bull market in history over?

Bull markets almost always end in excess. Can you think of a more excessive scenario for bonds than the one that is playing out today?

  • Fed is buying 60% of all new Treasury bond issues.
  • The Fed's assets (ie bonds) have ballooned from 6% to 35% of GDP in just 10 years.
  • Both short and long interest rates are way below inflation.
  • The US government wants to borrow even more.
  • Neo-liberal economists have concocted Modern Monetary Theory to justify even more money/debt creation.
  • Last, but certainly not least, cheap consumer goods from China kept inflation low for over 20 years. This is now clearly over. US-China relations are increasingly acrimonious and trade wars will raise import prices.

Let me put it this way: could the above have happened in 1985? I believe that had they attempted anything like it, Reagan, Baker and Volcker would have been publicly crucified in Times Square - right under that spinning Debt Clock.

Finally, some simple common sense, as in The Emperor’s New Clothes: would you right now invest your savings at 2.05% annually, locked in for 30 years? 

_______________________

PS Yes, yes, I know.. The Debt Clock was first installed in 1989. I'm using my blogger's artistic license, but just a bit of it :)