Saturday, October 13, 2007

Monkeys, Nuts and CDOs

Do you know how they catch monkeys in Asia? They make a box with a hole just big enough for the monkey's hand to fit through, put a lychee nut in it and nail it to the ground. The monkey shows up, pokes his hand through the hole and grabs the nut. But he can't get it out because his fist, holding the nut, is now too large to fit through the hole. The hunters come out of hiding with their nets, but the monkey does not flee - instead of letting go of the nut and running away, he just screetches in frustration as he tries to get his hand AND the nut out. In our business that's what happens to traders who hang on to losing positions. They can see the boom coming down on their head, but they just refuse to let go of their positions.

The same thing is happening to mortgage-backed paper these days. Defaults are rising, ratings are cut, market values keep coming down, but banks and hedge funds are stubbornly hanging on to their nuts. Bernanke cut rates and they took the SIV's onto their own balance sheets - and still there was trouble. The next ploy was to try and set up "separate" entities that would buy the paper from the banks at a slight discount, financed by the self-same banks. They call this an arm's length transaction, but it's their own arm inside the box holding on to the lychee for dear life. Now they are "negotiating" with the Treasury Dept. to find ways to revive the ABCP market.

Meanwhile, the market is clubbing away at their head. Week after week the amounts of ABCP outstanding are dropping and their yields are stuck high, while ABX indexes are melting away.


ABCP outstanding as of Wednesday, Oct. 10. (yellow line). Plunging still...

Charts: Federal Reserve


CP risk spreads have come down somewhat from their panicky highs, but are still very wide and getting sticky around 55-60 b.p. - unlike previous spike episodes. This is not comforting at all.


Absolute yields have come down, but once again ABCP rates refuse to go below where they were before the Fed's rate cut. For mortgage-backed traders/speculators those 50 bp never happened. Maybe the arbi desks will jump in and close the spreads, but... in which direction? Because if they end up also raising the rates paid by the financial firms (red line), it will be a Pyrrhic victory.


Even the newest vintages of ABX are weakening once again.

Chart: Markit


And how could they not? The real estate boom has turned into a bust, the economy is slowing and mortgages made under rosier-than-thou assumptions are simply not performing according to model. And they are certainly not performing as hoped.

Let go of the nut, Cheeta. That's not Tarzan you see coming at 'ya.

Friday, October 12, 2007

South Seas and China Seas

The South Seas Bubble (1720) is one of history's most notorious market bubbles. If you are not familiar with it, Wikipedia has an excellent entry on it, from which the following chart of the South Seas Company stock price is taken. Very smart people lost fortunes in the scheme (Sir Isaac Newton lost the equivalent of today's $4 million). The Company actually made little profit from trading goods and slaves with the Spanish colonies in South America - as was the charter of the Company. The bubble was formed, instead, when the company arranged to take over a large portion of England's public debt.

Ding, ding, ding...does this "arranged to take over a large portion of England's debt" ring a bell? Well, of course it does. The Seas are now further to the East, but the same elements are there: promises of riches from trade as a "hook", but the real money is made from speculating on financial assets.

Today's "China Syndrome" drives the following equation:

1.3 billion Chinese x (insert your product/service) = UPF (Unimaginable Profits Forever)

I close by providing a comparison chart, which I believe is quite apropos. It compares the monthly prices of South Seas Company stock from 1720 with today's prices of a cargo ship company stock listed in the US. I leave the name of the company out, for obvious reasons.


We can just as easily compare with a variety of other stocks... Chinese banks, for example.

__________________________________________________________________

PS September Retail Sales came in +0.6% vs. August, somewhat more than expected. Here is the breakdown:

Sales $Million

% Of Total

Weighted Change

Motor vehicle & parts dealers …….

78,653

20.69%

0.25%

General merchandise stores……….

48,526

12.76%

-0.01%

Food & beverage stores…………….

48,281

12.70%

0.10%

Food services & drinking places …

37,764

9.93%

0.00%

Gasoline stations ……………………

35,551

9.35%

0.19%

Building material & garden

29,541

7.77%

0.01%

Nonstore retailers …………………..

25,027

6.58%

0.07%

Health & personal care stores …….

20,197

5.31%

0.05%

Clothing & clothing accessories

18,936

4.98%

-0.02%

Miscellaneous store retailers ……..

10,396

2.73%

-0.04%

Furniture & home furn. stores ……

10,293

2.71%

-0.02%

Sporting goods, hobby, book & Music

7,565

1.99%

-0.01%

Electronics & appliance stores ……

9,500

2.50%

0.02%

380,230

100.00%

0.59%


Autos accounted for 0.25% out of the 0.60% increase. But the rest came almost entirely from gasoline (+0.19%) and food stores (+0.10%), which are actually indicators of accelerating inflation.

The more economically sensitive sectors, the ones that depend on discretionary spending like restaurants, clothing, etc., were flat to down. The consumer is not on a strike yet, but he is being extremely cautious.

And something else: food and gasoline combined account for 22% of all spending. Can we please stop this nonsense about "core" inflation?

Thursday, October 11, 2007

Let Them Eat...Whatever

This will be a very short post.

WalMart announced today that it will do slightly better earnings-wise despite mediocre sales (+1.4% for same stores) because it was able to cut costs. Other stores are not doing so well. Ho-hum.

But what about Wall Street? How does it see these news? My award for this week's crassest statement in the face of human misery goes to a Mr. David Abella, an analyst with Rochdale Investment Management LLC which manages $2.5 billion in assets, including WalMart shares.

``People still have to live their lives. It's not like somebody forecloses on their house, and then they just decide they're not going to eat that month.''

He really said that, look it up in Bloomberg - I am too sickened to provide a link. He doesn't care if people have no place to live, they STILL have to shop at WalMart where he is a shareholder.

For his children's sake - assuming that such a heartless man could attract a female long enough to procreate - I hope he never has to face the sheriff's deputies come to evict him.

My God... Has Wall Street sunk so low?

Tuesday, October 9, 2007

Dude, Where's My Bubble?

The 1999-2003 boom-bust in stocks and the more recent "event" in real estate has left most people thinking that markets always form and pop bubbles. "Where's the next bubble going to be?", is a common question these days, even by major-bracket investment house analysts. As I noted in a previous post, one of them even used the absence of a retail investor-driven bubble in US shares as a contrarian reason to recommend their purchase. Odd as it may seem, people seem to be hooked on bubbles.

Certainly, it's a big world out there and if you look at each market separately, across all asset classes and regions, then yes, there are bubbles and bubblettes forming and popping all the time. Last year the bubble in copper prices sadly caused people to be electrocuted when they attempted to steal high voltage transmission lines. A few months ago there was a bubble in the construction of corn ethanol distillation plants, which drove the price of corn higher. Severe droughts have caused a bubble in wheat prices. And there is a bubble forming in marine transportation shares, chiefly in bulk carrier companies.

But the biggest current bubble of them all is undoubtedly China - world class, global scale. I am not going to repeat what is going on there - we all know. I will isolate only two aspects:

a) The bubble in Chinese share prices is caused primarily by local ignorance of the very basics of investing and market economics. "China is in dire need of financial expertise", says Alan Greenspan in his new book and he adds, "...Chinese banks lack the professional expertise to judge what enables a loan to be repaid...To the extent that there are a lot of bum investments, part of the measured GDP is waste and of no value". These are very strong and direct warnings from a man who is otherwise famous for Delphic inscrutability and constant hedging of all pronouncements. (The Age of Turbulence, p. 307-308).

The fuel for this ignorance-driven bubble comes from the huge pool of hitherto stagnant bank deposits, formed after years of very high saving rates (40%+). After earning low rates of interest for years, they have now been unleashed unto the stock market. Well, as the saying goes, a few will make tons of money and the rest will, sadly, acquire "experience".

b) The PBoC is in a bind. After years of explosive monetary growth (20%+) which fortunately did not result in much inflation, China is finally and suddenly faced with two kinds of inflation at the same time: rapidly escalating consumer prices - chiefly for food - plus asset inflation in shares and urban real estate. They must have known it was coming (they have been raising interest rates and reserve ratios for months), but a pegged exchange rate removes the bite from their monetary policy bark. If China does not abolish the peg to fight inflation, it will eventually have to raise interest rates so much that will create very predictable negative effects for borrowers and banks.

In addition, if inflation is not combated right now, it will become embedded in peoples' expectations and result in constantly higher wage demands (structural inflation) - a clear problem for an export economy heavily reliant on labor cost arbitrage. With the "coming-out" Olympics due in 10 months, the political establishment may soon face a stark choice: a restless urban population squeezed by inflation vs. lower profits for business. If it comes to that, higher wages will win by a landslide - this is a country where communist roots are still very visible: Mao's portrait is on almost every banknote.

The Chinese government must allow the yuan to float freely, right away. China's is no longer a small, vulnerable and isolated economy; it is a major factor in the global economy and needs to adjust its currency accordingly. If it does not, it may soon find that politicians from the US and the EU will succumb to rising popular cries for the imposition of punishing import duties. The election cycle is a burdensome mistress, particularly if the domestic economy (eg in the US) is rapidly slowing down and scapegoats are needed.

Which takes us back to the "bubble" theme. So far China's authorities have not been effective in popping its asset bubble through half measures. I fully expect the next step is going to come soon and it WILL be effective.

So... there's your bubble. Don't go anywhere near it, unless you are the one carrying a big pin.

Monday, October 8, 2007

Assets , GDP and Debt

I have been saying ad nauseam that the US economy has become increasingly "asset-ized" and "financial-ized". A quick way to judge if an asset class is becoming overvalued against the economy's ability to produce goods and services is to examine the total value that assets represent vs. GDP, so without further ado here are a few charts.

First, the total value of stocks and Real estate vs. GDP for the US.


Data: FRB, World Federation of Exchanges
  • Total US stock market capitalization is now 151% of GDP, a percentage exceeded previously only during the bubble in 1999-2000. This ratio is double what it was in 1994, before the starts of the massive rally which culminated in the historic bubble. For comparison, Alan Greenspan made his famous "irrational exuberance" speech in 1996, when the ratio was at 110%. Stocks are not cheap currently, by any means.
  • Real estate valuations are in uncharted territory - all time highs, at least on a annual basis.
  • The sum of the two asset classes as a percent of GDP is also at an all time high of 380%. In other words, after stocks plunged in 2001-02, it was the turn of the real estate bubble to come in and save the day for the asset economy, and thus keep the party going.


  • The "party" kept on going because not only was the credit punch bowl not taken away, but it was brimming with debt hootch: Total debt to GDP rose to the highest level ever.


  • We see that debt/GDP went through four cycles of expanding faster/slower growth (blue line). The "debt junkie" economy apparently needed bigger and faster "hits" of debt to keep functioning. I have marked the chart below with the four cycles and a trendline.


  • It seems that in the past 2 years we may - just may - have finally broken the pattern of constantly expanding debt acceleration cycles. It does not mean that there is less debt, or even less debt vs. the overall economy; but it does mean that its growth is finally slowing down.
As the process of credit expansion slows down total asset prices will have to ease off. Perhaps we may experience the opposite of 2000-03, i.e. have another stock bubble to balance the collapsing values of real estate. I am sceptical of this possibility because global stock market capitalization is now back to the all time high vs. global GDP. Stocks are far from being undervalued, all over the world.


Data: IMF, World Federation of Exchanges


Friday, October 5, 2007

China Kettle, Dryer and Scale, Inc.

Big bubbles can be hidden behind seemingly irrelevant observations.

I happened to walk into a large appliance store yesterday; I wasn't looking to buy anything, just filling 15 minutes before an appointment. As I strolled down one aisle, I was struck by the huge number of different counter-top plug-in water kettles for sale. There were 32 different makes and models and the display took the entire length of the aisle. I thought that was odd. As I rounded the corner, I came to the hair dryer section: 42 models. Right next to them were the bathroom scales: 16 models. Nearly every item was Made in China.

By now I was baffled as well as bemused: who needs to choose amongst so many nearly identical items? My first reaction was to chuckle and blame our consumerist society; but that sentiment was immediately replaced by my curiosity for all things economic. Here was a major manifestation of the Chinese economy, on display as Kettles, Dryers & Scales. My conclusion, after some thought, is that its manufacturing-export economy has now reached a level that can best be described as absurd. Let me explain.

The sheer number of makes and models means that there must be dozens of different Chinese companies that make small appliances. There is apparently nothing to distinguish one from the other - there are no name brands that we would recognize as such - so the price competition must be incredibly fierce. Furthermore, the fact that the store is stocking and displaying so many of them must mean that the marginal cost of doing so is nil. Let me put it this way: a few days or weeks ago the store carried 41 dryers - what induced it to accept number 42? The answer is even lower prices and better payment terms - and this pressure is then immediately transmitted back to the makers of the other 41 dryers.

If you are China Kettle, Dryer and Scale, Inc. - one of the dozens of similar companies - what can be your sole business strategy for profitability under these conditions? Make it up on volume, of course. So you keep expanding your manufacturing capacity in the hope that, when the bubble bursts, you will be one of the lucky few that survives. Because it is quite clear that the system is now forcing the creation of a bubble - no way out, except perhaps to take advantage of another bubble and sell out by listing your shares on the Shanghai Exchange.

Can the manufacturing bubble continue? Given the intensely marginal nature of the business, the only way it can continue is by achieving constantly higher sales, i.e. by constantly enlarging the bubble. But if there is even a small slowdown in retail demand, and keeping in mind yesterday's post on the prevalence of the global Just In Time network, the negative effects on profitability are going to be instantaneous and highly destructive. The bubble will explode - not merely "pop".

What is the probability of this happening? Well, given that the largest consumer market on the planet (the US) is now definitely weakening and that the second largest (the EU) is not very far behind, I calculate that a slowdown in total consumer demand has already started. I certainly would not want to be an shareholder in CKD&S, Inc.

__________________________________________________
P.S. The "eagerly awaited" BLS employment report came out exactly as expected at +110.000 jobs for the month, though the month of August was revised at +89.000 vs. -4.000. The revision had to do almost entirely with the number of teachers going back to work, which was originally estimated too low. However, the relevant data one needs to look at in order to gauge the economy is the number of jobs added by the private sector.

Here is a chart comparing the jobs created during each of the first 9 months in 2005, 2006 and 2007. For the 9m year to date, 2007 is down 49% from 2005 and down 40% from 2006.

In other employment news, the Monster Index came out unchanged at 186 for September, while the BLS did its "birth/death" model revision and subtracted 297.000 jobs from what it had originally reported as created during the 12 months up to March 2007.

Thursday, October 4, 2007

A Tale Of Two Recessions

Macro-economists know that there are two types of recessions: the common economic decline variety which happens due to excess inventory accumulation within the normal business cycle and the Category 5 storm which results from consumers going on strike and sharply curtailing spending (let's call it "Katrina"). Therefore, here is a question to consider: can the US still have mild, inventory-induced recessions, or are we now destined to have mostly Katrinas, even if they only happen rarely?

Let's analyse the common recession first.

I believe that the inventory accumulation/liquidation cycle for consumer merchandise no longer plays the same role in the US economy as it once did, for two reasons:

a) "Just in time" (JIT) delivery has become the norm everywhere and has progressed to the point where a major retailer can place an order with a manufacturer in China and be confident that his outlets will receive the goods on specific days and times, ready to be sold to the consumer exactly as ordered. It is all arranged by the huge companies that have integrated container ship liner operations with local logistics (eg AP Moeller, Maersk, MSC). This means that much less inventory is now being maintained by merchants vs. final sales and that consumer behavior signals get transmitted to the factory floor much faster than ever before.

There is very little slack left in the manufacturing-shipping-distribution-retailing network. In other words, a merchant seeing his sales going down can and will instantly cut back on his orders to avoid a big inventory accumulation. The level of retailing/logistics technology has reached the point where most of this work is actually done automatically as a cashier swipes a product's bar code at the point of sale.

We can see the result as a steady downward progression in the Inventory to Sales Ratio in the chart below (click to enlarge).


b) The de-industrialization of the US economy has reduced its sensitivity to manufacturing activity and employment, i.e. there are fewer jobs that get affected by the inventory adjustment process. Instead, workers in foreign factories will get affected - and faster than ever before, given how little slack there is within the JIT network.

The two factors taken together mean that inventory imbalances are less likely to be the proximate cause of US recessions. In other words, it is unlikely that we will be getting many "common" type recessions in the future - at least in the US.

However, the US economy is now structured in such a way that it is more vulnerable to "Category 5" type recessions, caused by personal consumption declines. These are the reasons:

Personal consumption now accounts for 71% of GDP, the highest percentage ever (see chart below).
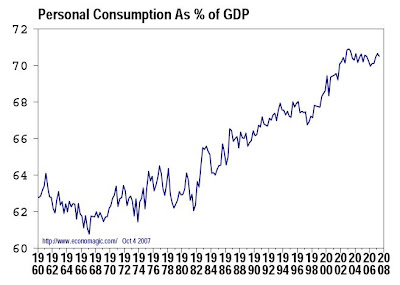
At the same time, such consumption has become more dependent on borrowing. We saw in previous posts how household debt increased much faster than incomes and we know that the saving rate is negative. All this means that unless incomes start rising much faster, personal consumption will be limited by the ability of households to borrow backed by the value of their assets, i.e. the wealth effect I discussed two days ago.

In addition, the ability to boost personal spending through tax cuts has been essentially eliminated after the repeated tax cuts of the current Bush administration and the parlous state of government finances (e.g. war spending).

In other words, the economy is now highly vulnerable to fluctuations in asset prices - mainly real estate, because this is the type of asset most commonly held by the average American (by contrast, 85% of all financial assets are held by a mere 10% of the population). In the past real estate values rose in a steady and measured pace with no overall extremes. All this changed starting as far back as 1992 and peaked in the 2005-06 bubble; the situation is now reversing rapidly, with housing prices falling in absolute terms for the first time since the Great Depression. The effect on household net worth for the vast majority of Americans is going to be severe. Rises is stock prices may create a false, or mirage sense of prosperity but this cannot last in the face of a 100 mph headwind caused by falling house prices. Remember - the vast majority of Americans own no stocks whatsoever, directly or indirectly.... but they do own homes, with mortgages attached.

There is no question whatsoever in my mind that the current situation will have a direct negative effect on personal consumption. We are seeing this happening already, as most retailers started to announce very meager sales increases on a month to month basis, significantly below the pace of inflation. The fact that personal consumption hasn't collapsed is probably due to what I call "wealth inertia": the vaguely delusional belief that "our house is still worth X", maintained because of so many prior years of increases. I am afraid that unless incomes start rising fast the economy may soon be hit by the next stage in the asset price cycle, which is none other than the "poverty effect".

If this were to happen - and we will know soon, as the most crucial period of Christmas sales starts to ramp up in a month - consumers will curtail spending in absolute terms, will seek to cut debt and replenish savings. This is the Katrina of recessions - a Category 5.

Final word... there is only one way out. Corporations need to immediately raise cash salaries and wages to boost confidence and maintain spending. Yes, this will cause an immediate hit to profits, but corporate earnings are already so elevated that the pace of LBO's, buybacks and special cash distributions is at an all time high. Better a bit of profit medicine than Katrina..

Wednesday, October 3, 2007

Monster Statistics

The Monster Employment Index is "a broad and comprehensive monthly analysis of of U.S. online job demand". It is calculated and released by Monster Worldwide, Inc. the large online employment company and it includes data from approx. 1,500 different employment sites. Why should you care? Because the Help Wanted Index of newspaper ads - the older, traditional gauge of current demand for employees - is no longer valid. The rapid spread and acceptance of Internet technology has completely changed the way employers advertise for open positions. Charts of both indexes are provided below.


This is the Help Wanted Advertising Index, published by the Conference Board. It is based on newspaper ads and several years ago it would point to a massive recession - but no longer, of course.


The green bars represent the Monster Employment Index (MEI), which is based on online job offerings and it obviously presents a very different picture, more consistent with what is actually happening in job creation and demand.


What is quite interesting with this index is that, unlike the Bureau of Labor Statistics monthly jobs data, it does not adjust its findings for the assumed "birth/death" of businesses, i.e. it does not add or subtract jobs depending on an estimate for the creation (or demise) of new business establishments. The BLS "birth/death" model is a very important element in the ultimate calculation of reported monthly job numbers; it skews them depending on its assumption of where we are in the business cycle. If we are deemed to be in an expansion, the model adds jobs to the actual BLS findings, on the presumption that the economy is adding new businesses and jobs quicker than the government can trace them - and vice versa if we are deemed to be in a contraction. This means that during inflection periods, i.e. when the business cycle changes direction - the job numbers as reported by BLS may be significantly overstated or understated until the "bias" in the model is adjusted.

Back to our charts: We observe that during the last six months the MEI is essentially flat and its annual rate of increase is rapidly coming down. This means the number of jobs advertised on the Internet are no longer rising from month to month. If we add that the Help Wanted Index is sharply down in the same period, we come to the conclusion that the total number of jobs advertised in the US is coming down. We don't quite know by how much yet, because the structural shift between newspaper and Internet job postings is still ongoing. But overall, it looks as if the employment situation has stalled.

Tuesday, October 2, 2007

Greenspan Speaks, I Listen

Today Alan Greenspan made several interesting comments: He stressed that longer-term inflationary pressures are rising, that agricultural price increases are not a mere short-term anomaly and that the potential costs of making a mistake in monetary policy are going up. In other words, watch out all you central bankers, if you cut rates too much you may end up with a big structural inflation problem in your hands. (Yes, this means you too, Mr. Bernanke). He also mentioned that measuring CPI inflation ex-food and energy is becoming increasingly less valid, but anyone who has been going to the supermarket in the past 12 mos. already knew that. Perhaps now that he has a bit more free time he pays closer attention to milk and cookie prices.

All of this may just be a "phantom Fed" condition for the ex-Chairman, like the person with an amputated hand or leg still "feeling" the lost limb, but I don't think so. His one true professional love has always been forecasting and that's why he was, on the balance, a successful Fed Chairman: he actually paid much closer attention to real business conditions instead of solely relying on Wall Street. What he is doing right now is forecasting the economy and doing so publicly - and for free! (Well, it does sell books).

But, all of a sudden, though everyone is listening to what he is saying, no one is paying attention. Gone are the days when Fed watchers would hang on his every phrase and punctuation mark to fathom his "real" thoughts. For example, he keeps on stressing that the US economy has a more than 33% and under 50% probability of going into a recession soon and has even recently raised this probability from a central 33%. The reason, he claims, is that 15% of personal consumption is a direct function of the wealth effect created by higher real estate and equity prices, chiefly through home equity loans and second mortgages. Since the rate of growth in US household net worth is flattening out, consumption is going to be affected - thus his recession probability predictions.

So, here is a chart of what Mr. Greenspan is talking about viz. household net worth (click to enlarge). The last data point is the second quarter of 2007, which is running at an annualized inflation-adjusted growth rate of 3.8%, which would have been even lower had it not been for shares going higher. The corollary is that if household wealth continues weakening - and it certainly was hit hard in the third quarter that just ended - then consumer spending will suffer, i.e. a recession.

Data: Federal Reserve

You would think that markets should be pricing this into their forecast for corporate earnings and adjusting share prices and risky debt accordingly, but no such thing is happening. Indeed, something else entirely appears to be at work: namely, a concerted effort to salvage household net worth (and thus consumer spending and the whole economy) by pumping share prices higher to mitigate lower real estate values. Call it manipulation, propaganda, convincing foreign "friends" to intervene with their (our) dollars... whatever. But this I can say, coming from my "stomach" where at least two decades of daily professional market experience resides: the probability of something out of the ordinary going on is more than 50% and less than 100%.

Monday, October 1, 2007

Household Debt and GDP Growth

We know that GDP growth relies almost entirely (over 75%) on consumer spending. We also know that starting in 2000 consumers went on a borrowing binge to purchase homes and other items, thus boosting the economy through debt. In the next three charts I will compare the growth of such household debt to the growth of GDP.

The first chart shows the annual rates of nominal GDP growth and household debt (mortgage plus consumer debt) for each year - click to enlarge. The disparity between the two becomes very wide after 2000 - debt grew much faster than GDP. The last two bars - showing a clear deceleration - are for the first half of 2007.

Data: Federal Reserve

The second chart shows the difference between the growth rates, i.e. how much more debt grew than GDP, in percentage terms. From 1975 to 2000, household debt grew on average 1.9% faster than GDP, but from 2000 onwards the difference rose as high as 7.3% and averaged 5.1%. Again, there is a clear slowdown in the first half of 2007 (last bar).


The third chart shows the RATIO of debt growth to GDP growth, to better examine their relationship independent of absolute values. Whereas until 2000 household debt grew somewhat faster than GDP (the average ratio of debt growth to GDP growth was 1.3), afterwards the ratio zoomed as high as 3.5 and is still quite high, though tapering off.


Conclusion: Our economic growth during the past few years was almost entirely a result of households consuming by going deeper into debt. It's not like we didn't know this already, of course, but a picture is worth a thousand words.

What does this mean for the future? As household credit becomes tighter - as is already happening - the economy will slow down fast, unless it disengages from consumer spending even faster and starts growing more in manufacturing, exports and capital investment.