Saturday, October 9, 2021

More Bond Tea Leaves

One chart in the "reading the tea leaves" technical analysis category.

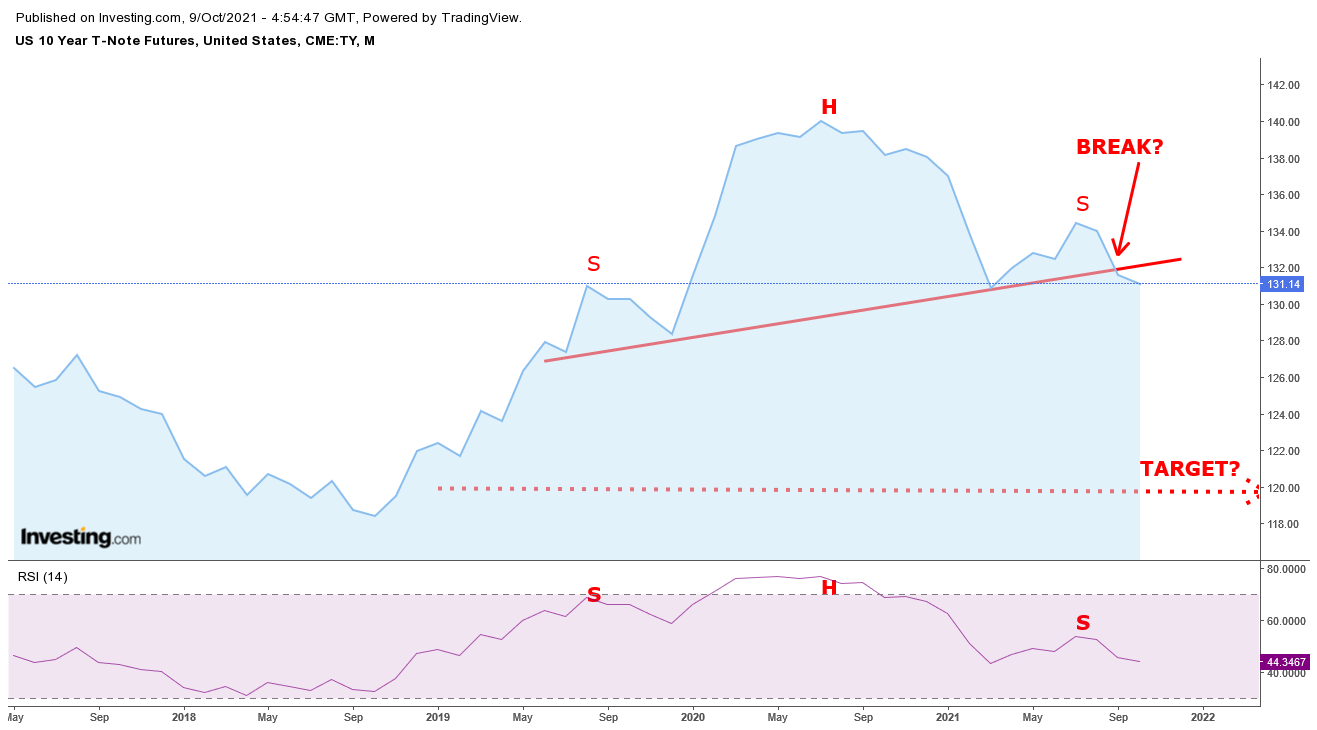
The chart for 10 Year US Treasury futures has formed a pattern known as a Head and Shoulders.  In technical mumbo jumbo is is considered the most powerful reversal pattern, particularly if it is confirmed by other indicators such as trading volume, Relative Strength, etc.  

With head and shoulders it is also very important not to jump the gun, ie one must wait for prices to cross the neckline decisively. Once a break is confirmed, technical theory says that prices will move at least as much as the height of the head above the neckline.


Assuming a decisive break has occurred (a big IF in the chart above) the target "reads" to a price around 120, a level last seen in November 2018, well before COVID and massive MMT-driven QE. 

For reference, the current 10 year yield is at 1.61% vs. 3.00% in 2018 and the latest CPI inflation reading (Aug. 2021) at 5.2% year-over-year vs. 2.20% in November 2018.

The case for bond yields at these low levels, much lower than headline inflation, rests entirely on the premise that inflation will revert to 2% very, very soon. Given what is happening with energy, commodity and transportation prices globally, this premise is rapidly turning into wishful thinking, 

 Dow Jones/S&P Global Commodity Index Highest In 12 Years

Doing paper napkin economics the 10 year should be yielding 5.20+0.80 = 6.00% .. it's totally far fetched, of course... but 3.00% seems rather logical - to me, anyway.

As always, these posts ARE NOT INVESTMENT, TRADING, SPECULATION OR ANY OTHER KIND OF ADVICE. It's merely me, myself and I talking to my rubber ducky.

Enjoy the long US weekend!


Friday, October 8, 2021

Risk Of US Default Rises

The Senate passed a stopgap measure last night to fund the government until around December 3. Did this improve or worsen the US credit profile? In my opinion, it made things worse.

Sure, the agreement averted an imminent default on Oct. 18.  But...

  • It is obvious that the US government and political system is in deep trouble. Things should never have reached this point of funding the country on a day-to-day basis, not for a AAA/AA+ rated sovereign, anyway.
  •  The debt limit process has to start anew and conclude in 6-7 weeks. The can was just kicked down the street a few feet (meters), the serious problem remains.
  • The stakes have been raised by the Republicans, who will now demand complete "surrender" on the Biden plan to spend $3.5 trillion.
  • The stakes have also been raised by the "progressive" faction of the Democrats who will accept nothing less than the $3.5 trillion.
  • Therefore, the probability of total political gridlock going forward is now higher than before.
  • Therefore, the risk of default - small though it may be - is higher today than yesterday. 
  •  Markets seem to agree: US sovereign Credit Default Swaps rose to 17.4, the highest level in one year, and the country dropped further to number 12 as a credit risk. 
  • The US is now almost twice as likely to default as Germany (0.29% vs 0.15%)


I will repeat my point of several posts ago: the US CDS are mispriced and we should now be using Germany as a benchmark for their proper calculation.  Following the methodology of my post produces a theoretical US CDS price of 134. That's a level almost 8 times higher than now.

And, I will say it again: it is the "unthinkable" that we must worry about and protect against.

Thursday, October 7, 2021

Raising The Debt Limit - What's It To Me?

Sometimes politicians make the stupidest mistakes and their actions reveal much more than their words.

So, Biden goes on TV to push for raising the US debt limit. To deliver this very, very urgent and important message, he asks some important people to help him drive the point home. Here’s who he invited:
 
The CEOs of:
 
1. Bank of America
2. Citibank
3. JP Morgan
4. NASDAQ
5. Deloitte
6. The National Association of Realtors
7. Raytheon (94% of its revenue comes from defense contracts)
8. Intel
 
and the head of
 
9. The American Association of Retired Persons


Thus:
  • Five out of nine are financiers 100% dependent on debt
  • One is the head of a defense contractor whose revenue depends entirely on funding (debt) decisions made by politicians.
  • One heads an industry that depends on ever more debt to finance ever more expensive homes.
  • One - just one - heads a true American tech champion
  • And, finally, one represents people who will really suffer from a government shutdown, if their Social Security payments are delayed

So, how is the typical middle class Mr. and Mrs. John Q. Public taxpayer, in whose name the already huge public debt will be raised even further, supposed to identify with those people and their institutions?  Why should they care? To fund the banks, the realtors and the defense industry?

Oh, and Biden is a Democrat, a member of the party that champions the working class - supposedly. Sometimes the truth is there in plain sight, on prime time TV...

But since this is a data driven blog, let’s look at numbers.

The 2022 US budget projects revenue of $6.01 trillion and deficit of $1.84 trillion,  ie this is what needs to be covered by more debt, ie an equal rise to the debt limit. If we decided NOT to raise debt, we must cut outlays and raise revenue by a combined $1.84 trillion. 

Here are some expenses we should not cut, in billion dollars

  • Interest on existing debt (must not default): 305
  • Social security, income security, Medicare: 2960
  • ===> Total untouchable: 3265
This leaves 6010 - 3265 = 2745 in all other expenses, (the largest is defense at 770 billion).

Given that we need to come up with 1840 to balance the budget, it is obvious that we can’t do it just by cutting these other expenses alone. So, here’s a novel (not) idea:

Cut defense by 50%: 385 billion - we are not at war and shouldn’t be the planet’s policeman, either
Cut everything else 25%: 690 billion
Total savings 1075. Still need another 765 billion ====> increase income and wealth taxes by that.  
Done.

Or, here’s another “radical” idea: the US burns through 500 million gallons of gasoline and aviation fuel per day! Tax it like the rest of the civilized world at $2.00 per gallon and you raise $365 billion per year. And gasoline would still be half the price than in Europe!!   

Sure, consumption will go down, but that’s what we need, no?


Wednesday, October 6, 2021

Some Bond Yield Levels To Look Out For

 In yesterday's post I wrote that the bond bull market is the longest and most significant in financial history. Yields on 10-year Treasury bonds have been dropping steadily from 10.50% in 1985 to 0.50% last year's pandemic low. They are at 1.57% right now.  

What could signal the end of this run? 

  • On a fundamental basis, it is already happening. We don't have to do fancy analysis: inflation is at 5.2% and the 10-year Treasury is yielding only 1.50%. Adjusted for inflation, bond investors are losing 3.70% every year - obviously, this cannot go on for long.The last time inflation was at 5% the bond yield was at 4% - see below.

CPI Inflation And Yields On 10-Year Treasury Bonds

  • On a technical basis (ie looking at chart patterns), yields are very close to breaching a technical resistance/reversal level on the upside. On the chart below, it's the lowest thin red line, a "neckline" for an upside head and shoulders pattern. Right now, that level is at 1.65-1.70%, and if it is breached decisively on the upside it "reads" to 3.00% (thick solid red line). But, at the 3% level the very long term channel will also be breached, so I would not be surprised to see rates go to the next resistance at  5.00-5.50% (dotted red line). And guess what? - that's where inflation is today.

 Ten Year Treasury Yield - Annotated With Technical Resistance Levels

  • All of the above is equivalent to reading tea leaves or consulting the oracle of Delphi  What is more significant, in my opinion, is that we cannot continue to run monetary policy on hope alone, hope that inflation will quickly subside back to 1.5-2.0%.  We need to face facts right now and act accordingly, before it is too late.
  • It's not like we haven't seen this before. A massive spike in energy prices in 1973 created a vicious cycle of consumer price and wage increases that lasted over a decade and eventually required extremely painful medicine to reverse, with short term rates soaring to 20%.

 Inflation And Fed Funds In The 1970s And 1980s  

  • One final remark, again on China-US relations. The tide has turned, we are no longer partners with mutual economic interests, but rapidly diverging adversaries. Do not - NOT - expect China to do us any favors. It will not keep buying ever more US bonds: they are already net sellers, despite ongoing huge trade deficits.  According to the US Treasury/Fed, China's holdings of Treasurys this July were $1.295 trillion vs $1.318 trillion in January (both including Hong Kong).  That's not a big drop, but consider that in the same time the merchandise trade deficit reached $187 billion. If anything, China's Treasury holdings should have increased, not gone down
Inflation is rising rapidly, bonds are at big negative real yields because of the Fed's daily manipulation (QE), and China is getting seriously antagonistic. Watch those tea leaf yield levels: 1.65-70%, 3.00% and 5.00%.  

Tuesday, October 5, 2021

The Biggest Bull Market In History

What is the biggest, longest and most significant bull market in the history of finance? No, it isn't stocks, gold, oil or whatever else. 

It's bonds - see below.


Yield On 10 Year Treasury Bonds

Yields on 10-year Treasury bonds have been coming down for 37 years, staying inside a very well defined channel from 10.50% in 1985 to 0.50% just last year.

At the same time, federal debt has increased from 44% to 125% of GDP. - see below.

US Federal Debt As Percentage Of GDP

Despite the massive increase in debt, interest rates were going down even faster. Therefore, the cost of servicing the debt dropped from 3.2% of GDP in 1990 to 1.2% in 2015 - see below. 

 Interest Cost On Federal Debt As Percentage Of GDP

However,  interest outlays have been rising sharply since 2015 despite record low interest rates.  Even with near zero rates during 2020, interest costs were at 1.65% of GDP.

Low interest rates have allowed the US economy to constantly borrow and spend excessively without much thought for the future. That's why I called the bull market in bonds the most significant in history - it is ultimately undermining American global preeminence.

During the Reagan years (1980-88) the rise in federal debt was constantly in the news. There was even a "debt clock" in New York's Times Square with numbers changing in a blur. Everyone was anxious about it - and it was at less than 50% of GDP!!  Today, it seems that everyone has forgotten it, throwing trillions around as if they were penny candy. Well, they aren't.

Today's meme is that debt doesn't matter because debt service costs are so very low and we can easily afford them. Yes, for as long as the bond market rally continues this is true - more or less. Rather less, actually, since 2015, as we see from the last chart.

Can interest rates go much lower or even turn negative, as in the eurozone?  I can't really see how they can in the US, barring a total economic collapse with thousands of corporate bankruptcies and debt write-offs. Two reasons:

  1. The Fed has been buying $120 billion of bonds per month, yet long term interest rates are rising.
  2. Inflation is going up at the fastest pace in decades. It’s all temporary say Fed and Treasury, but it feels more permanent with every passing day.

Thus, the trillion dollar question: Is the longest bull market in history over?

Bull markets almost always end in excess. Can you think of a more excessive scenario for bonds than the one that is playing out today?

  • Fed is buying 60% of all new Treasury bond issues.
  • The Fed's assets (ie bonds) have ballooned from 6% to 35% of GDP in just 10 years.
  • Both short and long interest rates are way below inflation.
  • The US government wants to borrow even more.
  • Neo-liberal economists have concocted Modern Monetary Theory to justify even more money/debt creation.
  • Last, but certainly not least, cheap consumer goods from China kept inflation low for over 20 years. This is now clearly over. US-China relations are increasingly acrimonious and trade wars will raise import prices.

Let me put it this way: could the above have happened in 1985? I believe that had they attempted anything like it, Reagan, Baker and Volcker would have been publicly crucified in Times Square - right under that spinning Debt Clock.

Finally, some simple common sense, as in The Emperor’s New Clothes: would you right now invest your savings at 2.05% annually, locked in for 30 years? 

_______________________

PS Yes, yes, I know.. The Debt Clock was first installed in 1989. I'm using my blogger's artistic license, but just a bit of it :)


Monday, October 4, 2021

Never Mind CDS, How About IRS And FRA?

I looked at US credit risk through Credit Default Swaps (CDS) in the previous two posts. Today I examine how a sharp upward revision of US credit risk could impact the global financial market through OTC derivatives on interest rates. 

The Bank for International Settlements (BIS) publishes a comprehensive survey every three years on such derivatives - the last one was for 2019. It also provides summary data every six months

Forward Rate Agreements (FRA) and Interest Rate Swaps (IRS)  are extremely common in banking, they are an integral part of the core, every day business for every bank in the world.  The US dollar accounts for at least 50% of the daily turnover for such derivatives and the euro another 25%.

As you can see below, the daily turnover for Over The Counter (OTC - not exchange-traded) dollar interest rate derivatives was approx. $3.3 trillion in 2019. Volume rose sharply since 2013 and as of the second half of 2020 the notional amount of such dollar derivatives outstanding was $152 trillion with a market value of $2.5 trillion. 

Daily Turnover In US Dollar Interest Rate Derivatives - OTC Only ($million)

If anything unexpected were to happen to US interest rates - say, from a sudden negative revaluation of credit risk - the upheaval on the derivatives market and through them  to the entire financial system and the global economy would be very serious.

Let’s look at an example for an interest rate swap. In such a derivative the counterparties agree to exchange interest payments between a short term benchmark and a long term benchmark (eg 3 months vs. 3 years). It’s the commonest way to manage yield curve risk by turning a variable rate into a fixed one and vice versa. 

Can you imagine what will happen if the US goes into some sort of technical default and the dollar yield curve goes bananas, either by becoming grossly inverted or steepens explosively? The IRSs (and FRAs) will certainly blow up, all $152 trillion of them. And those are just the ones denominated in dollars, the market in euros will definitely be impacted as well - that’s another 132 trillion euro.

To put it into perspective, the notional amounts of dollar and euro interest rate derivatives amount to 860% of the combined GDP of the US and Eurozone. (If we include all currencies the notional outstanding comes to $466 trillion, or 550% of global GDP.)

Coda: The more things change, the more they stay the same...

During the Great Credit Bubble the major accelerator of its formation and eventual  meltdown was the CDS market.  It had grown tenfold (!!) from $6.4 trillion notional outstanding in 2004 to $61.2 trillion at its peak in 2007. Today it  is a "mere" $8.4 trillion - people have learned their lesson, I guess. 

Or have they?

Turnover in OTC dollar interest rate derivatives has grown from $639 billion per day in 2013, to $1.36 trillion in 2016 and $3.3 trillion in 2019. We do not have more recent BIS data, but given the explosion in money supply in the last two years I expect these numbers to have grown substantially. 

Keep in mind that these numbers do not include dollar interest rate derivatives traded on exchanges, eg futures and options on bonds - these come to an additional $5 trillion per day

Therefore, the total turnover in dollar interest rate derivatives comes to $8.3 trillion notional per day. That's a very, very big market and we really, really do not want to upset it. Really. So, ladies and gentlemen of the US Administration and Congress, keep this in mind as you debate the debt limit. DNFΤU should rule your thoughts and actions. 

 Personally, I think that you are so irrevocably divided, even within your own parties,  that you may end up creating a big mess. (Trump is going to run for President again, isn't he...)


Sunday, October 3, 2021

More On US Credit Default Swaps

In yesterday's post I looked at rising prices for US Credit Default Swaps (CDS) as a possible indication for increasing tail risk, ie the possibility of a US default.  But then, I got another idea...

Are US CDSs priced correctly to begin with?  

First, s bit of background.

The most common way to calculate CDS prices is as bond yield spreads between the "riskier" credit and a "risk free" benchmark. In the eurozone, for example, the benchmark is German bonds - let's look at two countries’ CDSs:

 Germany  5 year bond yield: -0.59%

Spain 5 year: -0.34%    -----> Spread to Germany = 0.25% or 25 bp

Greece 5 year: +0.07%  -----> Spread to Germany = 0.66% or 66 bp

Therefore, we would expect their euro denominated 5 year CDS to be priced at 25 and 66 points respectively. As of Friday, their actual prices were 30 and 75 points. Pretty close, considering that CDSs are almost always more attractive/convenient, and thus more expensive, than putting on a credit spread trade by using the bonds themselves (there are difficulties arising from different coupon payment dates, availability and cost of borrowing bonds to short, etc). So, we can see that Spanish and Greek CDSs are accurately priced in the market. 


So, what about the US? How accurately priced are its sovereign CDSs? 

The first issue that arises is what benchmark to use in calculating a credit spread.  In the US we ASSUME that Treasurys are risk free, so we use them as a benchmark. As of last Friday the 5 year Treasury yield was 0.93%.  Therefore, a dollar denominated USA sovereign  CDS should be priced at 0.93-0.93% = zero, or nearly.  Instead, it is trading at 15 bp. Why?

Well, a CDS is similar to an insurance policy, a contract between the buyer and the seller of the CDS.  Therefore, there is counterparty risk involved, mainly that the seller of the CDS won't pay up in case of default.  Unlike during 2006-09, the CDS market now widely uses Central Clearing Parties (CCP) to reduce such risk. Organizations like DTCC come between buyers and sellers, aggregating and netting positions, mitigating individual counterparty risk to a significant degree.   

Still, there is some residual risk involved and not all trades go through CCPs, so a price of 15 bp above zero is not way out of line.  By comparison, the German sovereign CDS is also above zero at 9 points. There are also other, slightly more esoteric reasons why CDSs cannot be at zero, but let’s not go into greater detail. The main question is different: Are US CDSs properly priced on credit risk alone?

What if we were to assume the US was the “riskier” entity and Germany the benchmark “risk free” one? Then, the US CDS should be calculated as:

US 5 Year Treasury - Germany 5 Year Bund = 0.93 - (-0.59) = 1.52% = 152 points

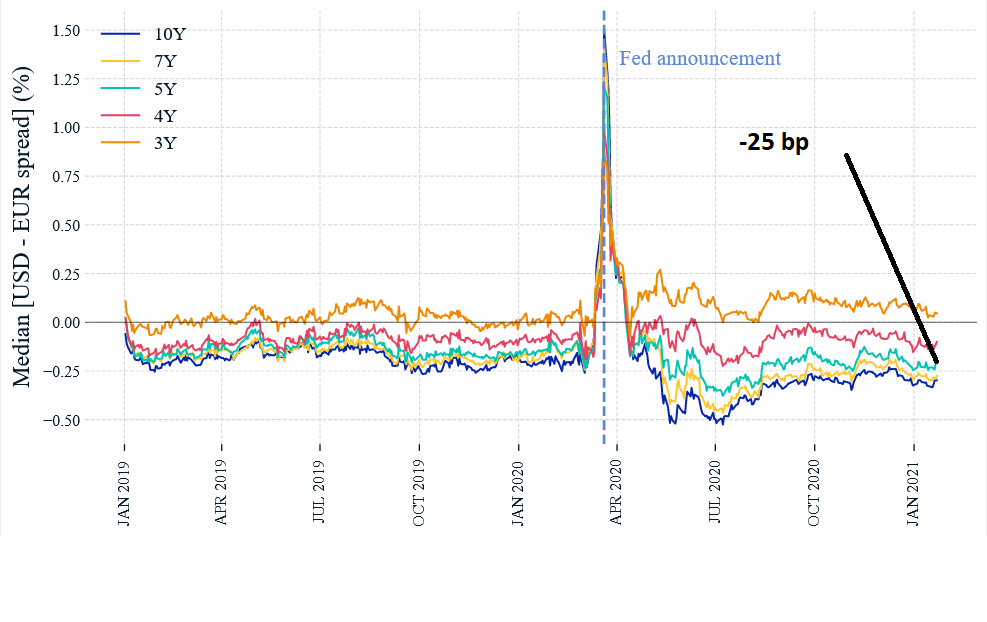
Ah, you say, this is not correct because this is a cross-currency credit spread, euro vs. dollar. You are right, we need to take the FX component into account. I will therefore use the MSCI calculation of USD-EUR cross currency credit spreads - chart below.


USD-EUR 5 Year Credit Spread at -25bp

Therefore, the theoretical calculation now becomes 152-25 = 127bp for the dollar based US sovereign CDS price.  That’s still very far above the market price of 15, by a factor of 8.5x, ie the US CDS is theoretically extremely cheap and greatly underestimates the probability of a US default. Looking at the table of sovereign CDS above, the closest in price to 127 is Mexico at 101, rated BBB with a default probability of 1.70% vs the US AA+ with probability at 0.26%.

Summing it up: if we use the assumption that Germany is a better credit risk than the US (it is) AND we use it to price/benchmark US CDS, then there is a very large price discrepancy, leading to the conclusion that the US sovereign risk is being greatly underestimated by the market.

Why? Because the US cannot default, right?  This may ultimately prove to be a very costly assumption, just as in 2006-08 when “house mortgages don’t default, right?


Saturday, October 2, 2021

Tail Risk: A US Default - Do The Math

Given the current debt limit squabble in Congress, how likely is a US default in two weeks? Don’t ask me, look at how the market is pricing such a tail risk. 

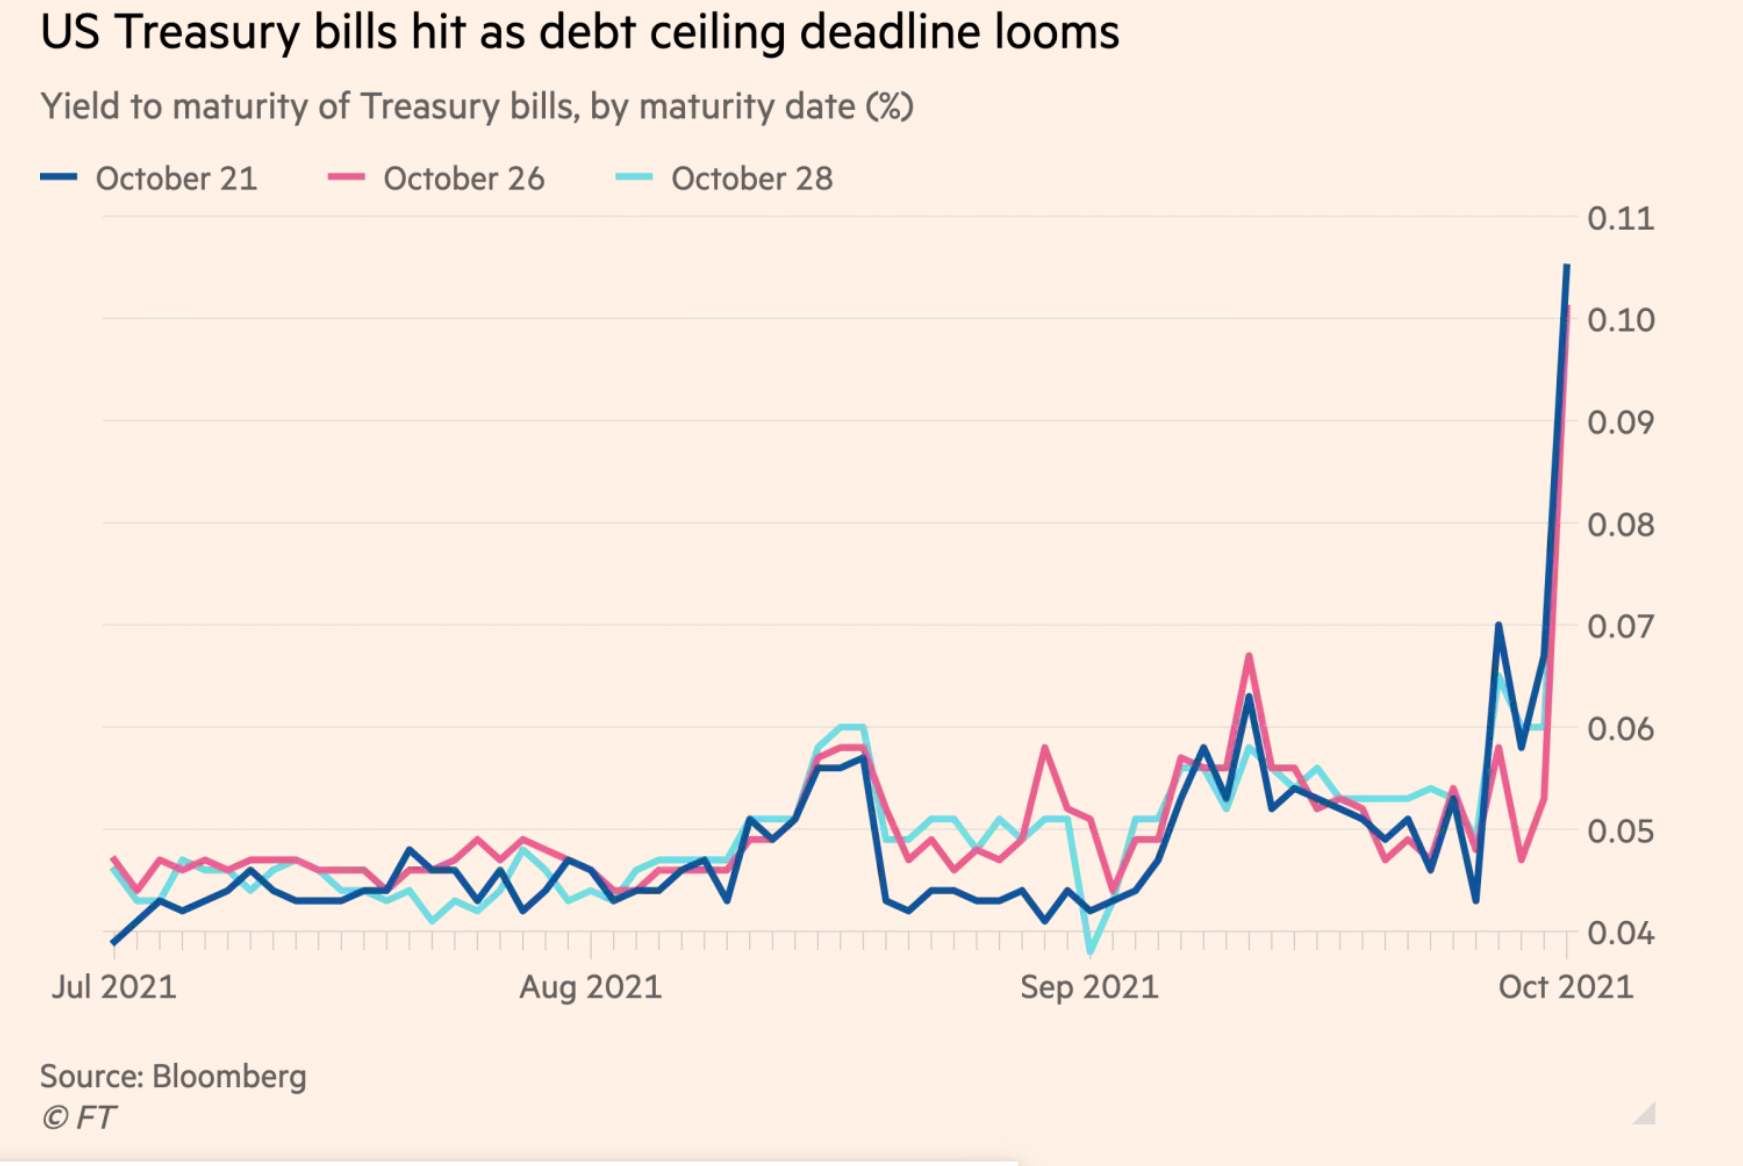
  • Yields for Treasury bills coming due after mid October more than doubled yesterday, shooting up from 0.04% to 0.14% intraday and ending at 0.11%. 


  • Five year Credit Default Swaps (CDS) rose to 15 points yesterday, up 50% in just one month. The US is now in 10th place on the list of sovereign risk, behind even Ireland. Remember, Ireland was one of the PIIGS requiring bailout funds from the EU. 

The market is clearly starting to discount a higher risk of a credit-related tail event involving the US. It may seem unthinkable that the US will default or delay properly servicing its debt (eg forcibly extend the maturity of Treasury bills and bonds coming due, thus going into technical default), but let’s consider how unthinkable it once was that..
  • Donald Trump would become President.
  • A President would scoff at scientists and recommend bleach as a viral remedy.
  • A huge angry crowd would attempt a coup by storming and occupying the Capitol, 
  • At least 30% of all Americans would believe that elections were rigged and stolen.
  • America would be so incredibly split in politics, ethics, beliefs and wealth (it happened before, and it precipitated the Civil War).
One of the most intriguing strategies in speculation is to bet on highly improbable tail events.  The cost is very small, but the reward can be enormous. If you are wrong you lose little, but if you win you win very, very big. 

Do the risk/reward math…(hint: you end up with the devil’s very own 666 😱)


Friday, October 1, 2021

Natural Gas Price Shock Due To Unprecedented Money Printing

I am always astonished, and sometimes angry, that many people scorn the Milton Friedman (Nobel Prize in Economics, 1976) dictum: "inflation is always and everywhere a monetary issue".  Obviously, they are adherents of voodoo Modern Monetary Policy, even if they do not know it as such.

Case in point: I recently got into a heated argument about government COVID handouts regardless of need ($300-400/week to everyone, plus aid to businesses) with a businessman who owns a small chain of retail stores.  I explained that the money came from the Fed printing trillions of dollars and, thus, every taxpayer got even deeper into debt. That it was a flood of inflationary money and that it was not a free lunch.

His reaction: it's just "Fed money" of no consequence to inflation, and that the debt could be "just written off by the Fed".  When I tried to explain that this debt could not be "just written off" since it was the asset backing the newly printed dollars (the Fed's liabilities), his eyes glazed over. He just could not accept or understand the concept of money/debt creation and dismissed me as alarmist. The discussion was over.

Because I know there are lots of people like him out there, here's the problem:

  • The Fed could get all those dollars back by selling the Treasurys it holds to the open market.  This would flood the market with bonds causing interest rates to spike, the debt would be unchanged and it would now be held by the private sector. So, it can't be done.
  • Or, the Fed could unilaterally forgive the debt and write off the bonds.  But then, what would back all those dollars in circulation? How would the Fed's balance sheet be balanced? It wouldn't, meaning the dollars would be, literally, worthless. So, that can't be done either. 

Back to Milton Friedman. Natural gas prices are exploding across Europe and Asia, with the US not far behind. The usual suspect being batted about is supply disruptions caused by the pandemic. Really? Hmmmmm... sure, there may be some, but certainly not enough for prices to rise from 20 to 90 euro per MWh -see below.
May be an image of text that says 'Trading at Record .Dutch ront-monthg gas Natural Gas Price 80 o Euros per megawatt hour May Source: ICE Jun Jul 2021 Aug Sep FRED 21T the United States M3 Money Supply Ap2020 Jul 2020 Oct 2020 Jan2021 2021'

Here's what I think Milton Friedman would say: 

You (Russia) are the owner of a finite good (natural gas) that you exchange for another good  (dollars, euros) whose quantity can be expanded ad infinitum at the push of a button.  You always watch carefully what the issuers of those currencies do, because you certainly don't want to be left with a pile of worthless paper and no gas.  

Very recently, you observe that the money issuers have thrown all caution to the wind and are printing them with complete abandon. What are you gonna do?  Duh! You will limit deliveries of your finite good and let the market sort out the price.

So, yes, of course there are "supply disruptions". But they are neither technical, nor temporary glitches in some Siberian pipeline. The sellers are just closing down the vanes - and can you blame them?

This is most obvious with Russian gas deliveries to Europe because( a) we're dealing with Putin's one man rule and (b) Russia has its own currency but sells gas in euros/dollars.

The US is somewhat different: (a) there are dozens of independent gas producers and pipelines and (b) they get paid in domestically used dollars. Even so, prices are double what they were pre-COVID since energy is a global commodity and quite fungible.

Bottom line: Are price hikes due to the pandemic or because of a flood of money? I vote for the latter.


US Natural Gas


Thursday, September 30, 2021

The US Economy: Is It A Couch Potato?

 The US is certainly the world's largest economy - but is it the healthiest? Today, just one chart says it all.

The Fed's balance sheet was a lean 6% of US GDP in 2008.  Then the Credit Bubble collapsed and the Fed had to step in to avert a total meltdown of America's financial system and a repeat of the Great Depression. It bought Treasurys and other securities (mostly mortgage-backed bonds), fattening its balance sheet to 18% of GDP.  But it wasn't enough. Though the immediate crisis had passed, the US economy wasn't really on solid footing, so the Fed kept pumping and buying assets up to 25% of GDP in 2015.  

Eventually things settled down, the economy recovered and the Fed eased back to 18% of GDP at the end of 2019. Mind you, 18% was still huge by any historical monetary/fiscal fitness standards.

Then the pandemic struck and the Fed threw all caution to the wind - its balance sheet assets exploded and are now at an obese 35% of GDP (2Q21 data) - see below.. 

The Fed Goes El Gordo 

What does this really mean? 

The Fed's assets are bonds: Treasurys, corporates, mortgage backed (MBS) and municipals (bonds issued by local governments). Therefore, the chart shows that the US economy is currently financed to a very, very great extent by its central bank.  And where does the central bank get the money to buy the bonds? Simple: it creates dollars entirely out of thin air, trusting (hoping?) that Americans and the rest of the world will continue to have faith in them. That's what I call faith-based financing - the American economy is now faith-based. "In God we trust", the motto printed on every dollar bill, now has literal meaning.

How healthy is the American economy? I don't know about you, but when I see an economy that floats on a rapidly rising sea of faith-based dollars, I worry about what will happen if this faith suddenly evaporates.

Let me put it in medical terms: a lean individual who eats right and exercises regularly has very few chances of getting a heart attack. But if he becomes a couch potato, puts on a lot of weight, eats burgers, fries and shakes every day, then he is a prime candidate for a sudden heart attack. And if he also believes/hopes that everything is fine, regardless... then he really has a death wish.

Interestingly, there is solid scientific evidence that such biological/social behaviour explains the rapid decline of empires (thanks to loyal reader AKOC for the link). Here is a quote from the article:

Most disturbingly, Dr Penman sees exactly the same process as taking place in our own age, but at a “far more accelerated rate” because of the West’s greater prosperity. The effects are already being seen in economic stagnation, a growing gap between rich and poor, and a collapsing birth-rate.