Sunday, April 29, 2007

What To Do With All Those Containers?
PBoC Raises Reserves Again..and Again...and Again

Global trade with China has spurred a massive build-up in containerships. It makes sense, up to a point, because parts and finished manufactured goods are shipped in containers and China is far away from the voraciously consuming nations of the West, requiring longer voyages. The proverbial "slow boat to China" has become an awesome fleet of modern, fast liners that continuously circles the globe. It is mostly a one-way trade that creates serious directional imbalances to the liner operators, but that is another subject.

Let's look at the data, from AXS Marine. In just six years, the existing carrying capacity in TEU (twenty foot equivalent containers, the standard measurement unit) has more than doubled. The number of vessels has gone up by 80%, indicating the drive towards bigger-size ships. The order book (ships on order) has also expanded fast.


For perspective, total capacity was around 3 million TEU in 1996, before the great Chinese trade explosion. So, in just 10 years the liner capacity has almost quadrupled. Where once factories in Akron and the Ruhr shipped their goods by rail and truck, now China's trade tsunami rolls upon the high seas in millions and millions of container boxes.

Can it be slowed down? As I expected, China's authorities are getting increasingly concerned that huge increases in capital investment will shortly lead to overcapacity: they just raised bank reserve requirements yet again from 10.5% to 11%, the seventh time in eleven months, in an effort to stem credit expansion (the "liquidity" I have been talking about). China's new bank loans are running at double the rate of last year: in just the first three months of 2007 new loans came in at 1.4 trillion yuan ($180 billion), half the amount for the whole of 2006. Interest rate rises are also in the works: PBoC's benchmark 1-year rate is at 6.39% with inflation running at 3.3%. Analysts expect a couple of more increases this year.

Late arrivals to the Chinese stock party have been thumbing their noses to authorities, currently driving stock prices up in vertical exuberance. They will soon realize that, as in any casino, the house always wins in the end.

CSI 300 Index

As for my friends in the shipping business.. the First Law of The Sea has not been repealed: it's still a VERY cyclical business, even if the current up-leg has outlasted every previous one. We really don't want to see the extra containers becoming modern "Hoovervilles" in Shanghai and Shenzhen - or the Ports of LA and San Diego, for that matter.

Friday, April 27, 2007

From The Sublime To The Ridiculous

The fixed-income side of finance used to be where "serious" business was conducted. Lending to governments and blue-chip corporations, bond issuance, mortgages, project finance... Oh, there were instances of excess from time to time when parvenus briefly rocketed to the bond limelight (Drexel and junk bonds, for example), but the market quickly corrected and went back to its staid ways. With good reason: borrowing large sums of money to finance governments and productive investments was at the very heart of the economy. But it has all gone to pot now...

"Debt" is a growth business just like "technology", "genetic engineering", "communications" or "dotcom". The amount of total debt versus economic activity (debt/GDP ) is at record levels (~360% for the US), with credit somehow extended even to the least credit-worthy. Sub-prime and liar loans, usurious pay-day lending and home mortgages in yen and swiss francs, mega-LBO loans and margin debt... a proper list is too long.

Naturally, dozens of spin-offs have been created to take advantage of the trillions in new debt: loan securitization, debt derivatives, structured bonds, debt and debt derivative indexes, hybrid products, correlation trades. They, in turn, are greasing the rails to make the issuance of even more debt easier - a huge upward spiral of debt and debt derivatives the likes of which the world has never seen before. We call it "liquidity", but this is dangerously misleading: the word implies a condition of being flush with cash and free of liabilities, liens and encumbrances - but the reality is exactly the opposite.

According to ISDA, the total notional amount of global debt-related derivatives outstanding (credit default plus interest rate swaps) has grown 460% from $70 trillion to an astonishing $320 trillion in just 5 years. These are truly hubristic rates of increase, particularly since published inflation is a puny 2-2.5%. The title of this blog, both literal and as an allusion to "sudden death", is inspired by just such numbers.

Prior instances of deflated exuberant silliness in internet grocery stores and miracle drugs were benign by comparison. The sums involved were much smaller and the damage was concentrated in just a few sectors of the economy. But debt is universal and at the core of our free-market, capitalist economy. If it gets too large it ends up seriously distorting and obscuring the value of all assets, as borrowing substitutes equity in the capital structure of households and corporations. A private-equity fund chief recently said that he can raise $10 billion (or more) in debt at the snap of his fingers; I strongly believe this to be self-evidently dangerous.

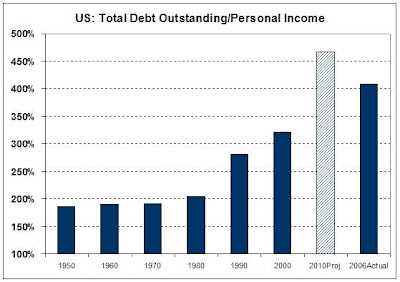
It's really simple: as debt balloons versus income it gets progressively more difficult to service and ultimately repay debt. Default ensues, debt gets wiped out and everyone gets poorer as asset prices decline to adjust to the new level of "liquidity". To get a measure of this I have calculated and charted historical levels of total debt vs. annual gross personal income (instead of GDP).

After decades of holding steady around 2 times gross income, total debt started growing quickly after 1980 and accelerated even more rapidly after 2000 to reach 4.1x at the end of 2006. If it keeps growing the same way, it will reach 4.7x by 2010. Pick a reasonable debt service rate (interest plus principal repayment) and you quickly see that things are getting dangerous: the debt-carrying capacity of the US is reaching a breaking point.

Therein lie expectations that we may soon suffer deflation, characterized by debt destruction and near zero interest rates. There is no way to inflate out of this monster and, in a peculiarly perverse way, it is easier (and more socially acceptable) for this to happen today than 20 years ago. Loans have been securitized and purchase by the top 5% of the US population to generate rentier income: they hold over 60% of national wealth. Banks are not as exposed to loans as they once were, having become loan packagers/merchandisers instead of lenders.

Apart from all "radical" notions of social justice, what would political leaders choose in a bind? To look after the 5% of their coupon-clipping voters, or the 95% of debtors and small-time bank depositors? Within a one person - one vote system the answer is obvious. The "sock it to the rich guy" bear may have been hibernating for years (decades, even) but she will wake up fast, furious and hungry when her stored fat runs out. In fact, the current negative saving rate and spending debt in lieu of income means the bear has run out of fat and she's surviving on muscle tissue. And not for long, because she's getting really disturbed in her sleep by news that the top 10 hedge fund managers made a combined $9.6 billion last year alone (we're talking about 10 physical persons here, not the funds).

So, debt having gone from a sublime business to a ridiculous bubble, it won't be too long before its popping. The physical world simply cannot forever sustain a trend that has gone parabolic.

Wednesday, April 25, 2007

Boeing, Boeing - Bong

Yesterday's data on March durable goods orders were "higher than expected" (+3.4% vs. February). Unfortunately, as the title implies, the strength comes almost solely on the heels of aircraft orders. See the charts below for a more sober look.


Doesn't look so hot, does it? The YoY graph looks even worse, with February and March coming in negative.

Why do I subtract aircraft orders?

a) It is a volatile data series, fluctuating widely month to month as new high-ticket orders are booked (or not).
b) Such orders are heavily influenced by the value of the US dollar. For example, right now Airbus is losing orders due to the high euro.
c) Aircraft orders are very cyclical and lag the economy. Airlines don't order planes until they are certain they need them, typically at the top of the cycle when load factors are very high. It takes many months to decide on a model, agree on financial terms and finally place a new airliner order.
d) By excluding aircraft we get a clearer picture of the "core" durable orders, i.e. the goods that are more commonly used in the economy day to day and have a shorter depreciation life.

Certainly, we should not underestimate the importance of aircraft manufacturing for the economy. It is one of few high value-added industrial sectors, where the US still commands a leading position, particularly when military aircraft are included. But what about the rest?

CDS's and Liquidity Generation

The latest ISDA survey puts the total amount of Credit Default Swaps (CDS) outstanding at $US 34.5 trillion, up from next to nothing just six years ago. Even as recently as two years ago there were "just" $US 8.4 trillion. Does this mean anything for the "real" economy, beyond the regular incantations about "spreading risk around", "lower risk premia", "reduced volatility", etc, etc ? Yes, it does.

(A) First, we must remember that "liquidity" is just another name for debt: liquidity is created via the assumption of debt and its price is the interest rate charged to borrow it.

(B) Second, we should note that CDS's are streams of regular cash flows: an upfront payment plus regular, fixed payments for the duration of the contract. This is the reason they are sometimes called "counterfeit bonds".

(C) Thirdly, their issuance is not limited by ANY sort of regulation, barrier or corporate requirement for debt financing. As long as the "market" buys them, issuers keep selling them.

Put A, B and C together and what do you get? Artificial debt creation (i.e. liquidity), regardless of the need by corporations, individuals or governments to borrow for factories, homes or teacher salaries. This type of liquidity creation is also very difficult for central banks to contain with monetary tools: it is not directly impacted by higher or lower interest rates, but by the perception of default risk.

Naturally, $34.5 trillion is the notional amount - the amount due if default occurs, not the market value of the contracts. To approximate how much "liquidity" is created by the CDS's, we need to know their current market value. ISDA does not collect such data, but the Bank for International Settlements does, though its data only goes to June 2006. At that time market value was 1.44% of notional; applying the same percentage to the latest data ($34.5 trillion) we come up with $497 billion, i.e. a half-trillion dollars of "liquidity" is sloshing around that was not created to fund anything other than "creative finance" ...and it is growing 100% every year!

Now, add this dirt-cheap money to the yen "carry" and we may currently have a pool of up to $1.5 trillion in loose, hot cash whizzing around, looking for "investments". I think it goes quite a ways in explaining global market levitation, no?

Monday, April 23, 2007

They've Lost Their (Rice) Noodles

The chart below is for CSI 300, the broad capitalization-weighted index for Chinese stocks - something similar to S&P 500 for the US market. It basically speaks (screams) for itself: up 3.1 times in 12 months, with a furious 40% in just the past couple of months.

China's CSI 300

The market is white hot: stockbrokers in the Heavenly Peopledom are opening as many as 282.000 new accounts every single day. So far, a stupendous 2.76 million new brokerage accounts have been opened just in April - and the month is not yet over. For comparison, there were a total 3.08 million accounts opened in all of 2006. There are now 91 million brokerage accounts in China (is this communal capitalism, or what?). Let's pause for a second right here, because these numbers are so large they require some quickie analysis.

Back of noodle wrapper calculations, plus some qualitative observations

a) Market penetration

The population of China is 1.3 billion. Divide by 3.4 to get the number of households: 382 million. Communism or not, some people are poor and/or they don't have excess income to invest. Let's call that 30% of the population, or 115 million households, leaving us with 267 million households. Take out another 3% for those over 75 years old, and we are left with 260 million nominally "eligible" investor households. Divide 91 by 260: 35% of ALL theoretically eligible households already have a brokerage account and this percentage is now growing by 1.5% every MONTH. Who is left to buy?

b) Valuation

Total market capitalization is around $2.3 trillion, or 85% of GDP, comparable to, or higher, than most developed, free-market economies. Given the only recent explosion of market economics across China, a large share of GDP is still produced by small non-publicly listed companies, plus large state-owned concerns. This makes the 85% figure very large, by comparison. In addition, price to earnings ratios are ~50x on average, with some companies over 100x.

c) Currency

The yuan is hard pegged to the dollar - what you see in the chart is what you get, in equivalent dollar terms - i.e. it is not double-digit local inflation or currency devaluation that is goosing nominal prices artificially higher.

d) Individual Speculator Excess

For the past few years, individual speculators have been mostly absent from western equity markets, leaving the field open to professionals who have driven them slowly, but persistently, higher through the massive injection of debt capital. There has been no easily visible "excess", of the kind made famous by the dotcom mania, to point to a final western market blow-off.

However, we have exactly that happening right now in China, with indexes going vertical (see chart above). Recent global market behavior (February - March) has shown that a plunge in Chinese stocks has a quick and ugly domino effect all over the world. When the party ends in Shanghai the hangover will spread all over.

e) Debt Effects

Chinese savings finance a large part of global debt, particularly in the US. If (when) they go up in smoke, after the speculative equity bubble bursts, who will buy all the Treasury, mortgage and LBO debt that is gushing out in incredible amounts?

Conclusion: Chinese equity markets are now filled to the rafters with hard-plunging, inexperienced individual speculators, determined to make a fast yuan. The recent plunge and come-back of February-April has convinced them that they are invincible and has produced even more fever. We have seen all this before and it ALWAYS leads to pain; the higher they fly the harder they fall. This is a fact that Chinese monetary authorities are certainly aware of and should try to contain before the consequences of the aftermath become too serious for the "real" economy.

Gone To China
Everyone knows that China has become the manufacturing center of the world, destroying millions of goods-producing jobs in the rest of the world. But how many jobs are we talking about? For the US, at least, lots.
  • I have fallen and I can't get up: within just a couple of years starting in 2001, the US lost 3 million manufacturing jobs. Despite the economic recovery that followed, manufacturing is still shedding jobs.
US Manufacturing Jobs

  • Service with a smile: against this fearful depression in domestic manufacturing, 6.6 million service jobs were created after 2001.
US Private Service Jobs
  • IV drips and lattes: Looking closer at those 6.6 million new service jobs, we see that most of them were created in Health Services, Professional and Business (legal, accounting, temps, etc.), Leisure & Hospitality (includes food establishments). Interestingly, despite popular perceptions of minions of MartMart greeters, Retail created only 320.000 jobs. Information lost -450.000 jobs.
New Service Jobs by Category

I proclaim as self-evident that a highly developed economy that depends on healthcare, lawyers and lattes for 80% of new job creation - while shedding millions of jobs in manufacturing - is in the deepest possible trouble.

All data from the Bureau of Labor Statistics

Friday, April 20, 2007

Commercial Real Estate...Again

I will once again focus on commercial real estate and mortgages. While popular attention is currently focused on residential sub-prime and near-prime mortgages, commercial mortgages are also - ever so quietly - crumbling all around us.

The CMBX indexes produced by Markit track the default risk of securities constructed from commercial mortgages (CMBS). Just like the other indexes, CMBX has several tranches rated from BB to AAA. Here are some charts tracking their yield spreads (the higher the spread, the worse the performance).
  • The lowest, "junk" rated BB tranche has zoomed to 412 basis points (4.12%), up sharply from a "reasonable" 160 bp just six months ago.

CMBX-NA-BB 2
  • The BBB tranche (officially investment grade) has gone from 45 to 164 bp.
CMBX-NA-BBB 2

  • The A rated tranche is suffering badly, up from 12 to 60 bp.

CMBX-NA-A 2

  • But even the super-safe AA tranche is taking a beating, from 8.5 bp to 24 bp.
CMBX-NA-AA 2

Such CMBS securities are the second largest sector in structured finance, after residential mortgage bonds (RMBS). According to the Commercial Mortgage Securities Association, CMBS issuance in the US alone reached a record $207 billion in 2006. International issuance is growing too, bringing the total to $302 billion.

CMBS Issuance ($US Billion)

Although still relatively new in bond markets, CMBS's are a significant part ($770 billion) of the total $3 trillion in commercial US mortgages. For comparison, RMBS are at $6 trillion, US Government bonds at $4.9 trillion and corporate bonds at $3.2 trillion. No small change...

Commercial real estate includes multi-family residential and office, commercial, etc. buildings. Activity in this sector of the construction business is still quite strong, probably due to the longer lag time needed to obtain local permits and financing for such larger projects. For February 2007 vs. February 2006, total spending for non-residential construction was +13.6% vs. residential being -15%. For example, office construction was up 27%, lodging up 53%, healthcare up 15% and commercial buildings up 9.5%.

For the whole of 2006 vs. 2005 non-residential construction spending was +13.6% vs. residential at -1.8%. In dollar terms, 2006 residential construction spending was $639 billion and non-residential $558 billion - almost the same.

It is plain that non-residential construction business is just as important as home-building and therefore terms and conditions for commercial mortgage loans can impact the overall economy significantly. The recent run-up in the CMBX spreads is a bad omen for loan availability and cost and may soon translate into lower activity in a sector that has been healthy, until now. And that will be the point in time when total construction employment finally takes a significant hit (see two previous posts).

Thursday, April 19, 2007

Odds and Ends
  • The International Swaps and Derivatives Association (ISDA) just announced the results of its 2H06 survey and, as I expected, Credit Default Swap (CDS) notional amounts outstanding at the end of 2006 reached $34.5 trillion, up 102% in just one year. I hasten to add that just six years ago there were only $631 billion outstanding. It is now easier, cheaper and more "efficient" to trade and hold CDS than bonds. Talk about the tail wagging the dog... Interestingly, some regulated exchanges (eg EUREX) have tried to get into the game by introducing listed CDS contracts, but the big boys like JP Morgan, Goldman, Morgan Stanley and Deutsche are snubbing them, big time. Why spoil their OTC fun and games? Pay close attention to this, because the ability to ultra-influence debt markets has far-reaching consequences for every soul on the planet. (For example: who is calling the shots? The ECB, Fed and BOJ and associated politicians, or the above four institutions that control 90% of the CDS market?)
  • Based on a reader's comment to yesterday's post, I have looked a bit deeper into the US construction jobs data.
There are now 7.7 million jobs in construction, or a record 6.7% of all private sector jobs in the US.
Almost 7% of all private jobs in the US are now in construction

Between the end of 2000 and 2006, there were a total of 3.37 million new private jobs created. Out of those, 900 thousand or 27% came in construction alone.

But it gets even more interesting if we add another two directly related job categories: Real Estate and Architectural Services. Combined with Construction, the three sectors created a total of 1.26 million jobs between 2000 and 2006, or an eye-popping 38% of all new jobs. And this is before we take into account all the other affected sectors: mortgage finance and servicing, legal, insurance plus the furniture and homeware retailers.

Wednesday, April 18, 2007

Construction Jobs in The US

There is a discussion over at Nouriel Roubini's blog about construction jobs, so I have produced a few charts from the Bureau of Labor Statistics. While the absolute number of such jobs is still rising, the rate of growth has plunged sharply and is now touching zero. In my opinion, overall construction jobs are being supported by older (1 yr+) housing contracts still in the pipeline and by non-residential projects that are currently quite strong.

Click on the images to enlarge them.
  • Total construction jobs have stopped growing.
Total Construction Jobs
  • Residential construction is starting to lose net jobs.
Residential Construction Jobs

  • Non-residential construction is still adding jobs but at a rapidly diminishing rate.
Non-Residential Construction Jobs

In summary, I think we will soon start seeing significant job losses in the construction sector as existing contracts for homes are completed and are not replaced (new starts are down 30+%) and non-residential winds down as well. How many jobs? Total employment in the sector is currently 7.7 million and during the previous major downturn in 1990-92 as many as 10% of the jobs were lost. If we run along the same course, we could be losing ~65.000 jobs per month. In the past 12 months we were adding an average of 125.000 new jobs per month in the private sector, so such a loss from the construction sector alone could be very significant.

Tuesday, April 17, 2007

Retail Sales Slowing

Data for US retail sales were reported yesterday and I have produced a chart of such sales minus gasoline and food stores, i.e. the discretionary "stuff" we buy that truly drives the economy. Sales growth is dropping and if we take into account inflation of around 2.5%, such sales are essentially stalled. The shutting down of the house-as-ATM is starting to have a measurable and clearly visible effect. I think we may also see a rise in the saving rate over the next few months.

Monday, April 16, 2007

But...Who Is Buying The Stuff?

I have often talked about the various structured finance "securities" (a misnomer, if there ever was one) like hybrid CDOs, yield steepeners and double-no-touch FX bets. In my opinion, they are mostly designed to produce huge fees for their underwriters and not much else; but if this is so, who is buying them? After all, there can't be THAT many gullible investors out there to absorb the hundreds of billions in such new issues.

In fact, there aren't - at least not directly. Instead, a huge scandal brewing in a certain south-eastern EU country (see The Economist article here) involving structured-finance bonds stuffed into state-controlled pension funds, points to the answer: cherchez l'argent.

Turns out, for two years now at least two dozen such pension funds (and a few state-controlled banks) have been selling out of their plain vanilla fixed-coupon government bonds en masse, to buy "structured" bonds. Such bonds are issued by local and foreign banks and by the government itself, desperate to achieve immediate debt reductions to escape EU sanctions. Why should the - putatively independent - pension funds buy them? A couple of reasons:

a) There are large fees involved: a typical "structured" product will involve at least 3-4% in fees vs. a plain Treasury bond, which is essentially commission-free. Some of the fee money may have found its way to pension managers' and middleman hands via kick-backs. In fact, recent revelations make this a certainty for at least a couple of egregious cases, involving one bond that was issued at around 88 and sold to four pension funds at 100 (par) in the same day! In the other case, a plain vanilla government bond was purchased for 106.75 when the going price was around 100. There were hundreds of millions involved in just those two cases, so the "fees" and potential kick-backs were in the tens of millions.

b) Under-funded pension funds are always yield-hungry and such "structured" products typically dangle an up-front lure, in the form of initially above-market interest rates (for example, 6.0% for two years, resetting afterwards based on the difference between 10-year bonds and 3-month bills). The boards of pension funds are mostly comprised of financially un-savvy labor union representatives, so orchestrated malfeasance was easy to achieve.

Bottom line? There are hundreds of millions of individual buyers of such structured debt products all over the world, but they are not aware they are buying them. Instead, it is their supposedly staid and conservative pension funds that are frequently "investing" in them. Why? Like I said, cherchez l'argent. If you prefer Latin, qui bono?

Naturally, there isn't always malfeasance involved. Pension funds are frequently forced to move into riskier investments because their demographic/actuarial balances are turning more and more negative. The western world is ageing at the same time when the imposition of the low-taxation economic model is keeping tax revenue below what is needed to properly pay pensions. The only thing left to pension fund administrators, squeezed as they are between increased outflows and decreased income, is to hope for higher returns on their existing assets via more risk.

The combination of huge fees, underfunded pension plans and glow-in-the-dark artificial lures has made the hidden hook irresistible. Pity us fish.

Thursday, April 12, 2007

Two Classic Books

Pumping up asset prices is easy as pie, under the right circumstances and loose moral inhibitions, a.k.a. intentionally blind regulators. For the best explanation on how such manipulation is performed, please read "Reminiscences of A Stock Operator" a book about Jesse Livermore - one of Wall Street's most famous plungers.

What's wrong with rising asset prices? Nothing - as long as there is little or no debt associated with them. But when real money is borrowed by the gullible crowd against artificially inflated securities, then real trouble lies directly ahead.

And since I said "crowd", I refer you to "The Crowd" by Gustave Le Bon, another classic written over 110 years ago. It is not directly related to markets but it is considered a ground-breaking study of mass psychology and crowd behavior. Some snippets from the book:
  • "Crowds do not accumulate genius, but mediocrity."
  • "Since the crowd is not impressed by anything but violent feelings, the orator whose aim is to subjugate and lure must seduce with intense assurances. He must exaggerate, assure, repeat and never attempt to prove anything by logic..."
  • "The events that must be doubted more than all others, are surely those that were witnessed by the greatest number of people."
So, beware of the certainty of current high asset prices - particularly under the enormous debt loads they "support".

Wednesday, April 11, 2007

The Dog Ate My Homework

Mainstream economists from investment banks - usual permabulls - are starting to hint that the US economy may be slower than initially estimated, at least for the first half of 2007. No news there. But I was astonished to hear the reason: bad weather! If serious people scrape so deep down in the barrel to come up with excuses...

Personally, I prefer Occam's Razor: The simplest, most obvious answer is usually the correct one. Personal consumption is 70% of GDP and it is highly susceptible to easy access to cheap credit, via tapping inflating assets. End of story.

All other excuses smack of schoolboys, missed homework assignments and pet canines with an unusual appetite for paper.

Thursday, April 5, 2007

China = 1.3 Billion
India = 1.0 Billion
Σ = Deep Trouble

The People's Bank of China (PBoC), the country's central bank, today raised bank reserve rates yet again by 0.5% - the sixth time in a row. Banks must now re-deposit 10.50% of their deposits with the PBoC instead of loaning all the money out. Loan growth is zooming, with M2 rising 17.8% in February. With the yuan effectively hard-pegged to the US dollar, monetary policy is becoming a weak tool to control inflation and growth rates - unless it becomes truly draconian.

The PBoC has a problem in its hands: it's called wild-eyed capitalism after decades of Maoism, state control-ism and creaky bicycles as worker productivity rewards. In other words, "how are you gonna keep 'em in the farm after they have seen Paree?" - and the Chinese are notoriously infamous traders, speculators and gamblers.

This will end in tears simply because of the Law of Very Large Ugly Numbers, as in 1.3 billion people wanting to own a car - or even a scooter. Did I hear you say "India"? As in another billion souls? Unless we import energy from a black hole and copper from Mars it can't be done.

So...here's the hard brick wall(s): The US numbers 300 million people and consumes 21 million barrels of oil per day (mbpd). China's consumption is 7 mbpd and India's 2.5 mbpd. See anything wrong with these numbers? How long can growth be sustained in China and India before we end up nuking each other for precious natural resources? Or cooking ourselves in greenhouse gases?

Here's a chart, just for laughs.

Oh, sure this can go on indefinitely....no worries at all.

Monday, April 2, 2007

Debt Around The World (and aye, aye, aye...)

From a recent OECD study (PDF file) I extract some interesting charts on household debt.

First, the opening paragraph from the study:

"Over the past decade, household debt has risen to record levels in a number of OECD countries. The large size of these debt run-ups, coupled with, in several instances, changes in the characteristics of some of the relevant instruments, are estimated to have raised the sensitivity of the household sector to changes in interest rates, asset prices and incomes. In this sense, the household sector may have become more vulnerable to adverse shifts in these variables."

(Click on the charts to enlarge)

In Chart 1 we observe that household debt has doubled as a percentage of GDP in the past 20 years, now around 80% on average. Economic growth is now heavily dependent on continuous, easy access to cheap debt.

Chart 1

In Chart 2 we observe that around 70% of all household debt is in the form of home mortgages. This points to housing (and housing related debt) as the major driver of OECD economic activity: home mortgage debt is now 55% of GDP, up from 35% just 10 years ago.

Chart 2

The OECD study also contains interesting data on the dispersion of household debt between income groups. Chart 3 shows the distribution of debt by income percentile. It looks like in the US, Canada and New Zealand almost everyone owes some debt.

Chart 3

Another observation from Chart 4 is how much income goes towards debt service: in the US, ninety percent of all households that are in debt must devote around 20% of their disposable income to pay off debt. Only the top 10% are less vulnerable, paying around 12% of their income.

Distribution of debt service burden by income percentile
Chart 4

It boils down to housing activity being the key to the financial health of households and the overall economy. Should home prices and/or credit conditions turn negative the impact to GDP growth will be very significant. The statistics show that this is particularly true for the US (and NZ) as debt loads are high and impact all income sectors.

The end of the real estate bubble is going to have lasting effects and won't be isolated to just the construction and related sectors. I believe that the weakness we are currently experiencing is only the beginning of a mounting problem caused by excessive debt, not a "soft spot" in an otherwise vibrant economy.

Sunday, April 1, 2007

CDO-Squared Story

Just a link to a very interesting Reuters story on the issuance of even riskier CDOs based on other CDOs containing sub-prime mortgages and/or CDSs.

"With the subprime mortgage crisis making investors wary of collateralized debt obligations, or bonds secured by other bonds, Wall Street is cooking up even riskier deals offering bigger returns to lure hedge fund investors."

Some of the deals apparently offer potential returns of 40% - with commensurate risk, of course.

Another interesting item from the story is that rating agencies are still keeping "A" ratings on CDOs that yield 500-600 basis points (5-6%) above benchmark returns...hmmmm.

Read the story - it's enlightening.