What's the point of critical mass? When do consumers finally realize the direness of the situation and everything starts unwinding?This is actually a very intriguing question, so I will attempt an answer below.
____________________________________________________________
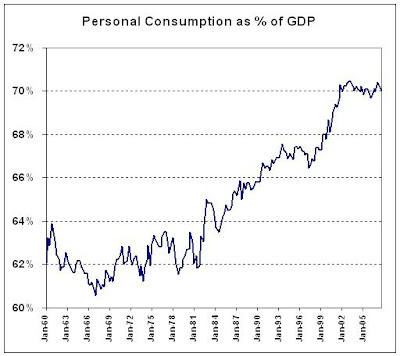
Betting against the propensity of the US consumer to shop, come hell or high water, has been a bad wager for decades. Consumer spending now accounts for 70% of US GDP, the highest proportion ever
(see chart below).
 Data: FRB St. Louis
Two questions arise:
a) What allows the US consumer to keep spending?
b) Can it change suddenly (critically)?
The mechanism that kept consumer spending high and rising over the years, was quite simple: less saving and more borrowing. Starting in the mid-1980's the saving rate (the portion of disposable income not spent) moved lower, eventually reaching zero, and household debt rose sharply from 65% to 135% of disposable income. Not to mince words, Americans live hand-to-mouth and are in debt up to their eyeballs. Under these circumstances, it is little wonder that consumer spending is kept aloft. But what's lurking down below?
 Data: FRB St. Louis
The expense for basic, non-discretionary items like food, fuel and debt service is rising once more
(see chart below, current to end 2006). Coupled with zero saving, this potentially spells trouble for spending on discretionary items, where demand is more elastic.
Hand-to-mouth, high debt and rising bills for necessities... doesn't sound too promising. What could tip the whole thing over?
 Expenses for food, utilities, heating fuel, gasoline and financial obligations (2006)
Americans now live paycheck to paycheck. If they lose their jobs they will immediately cut down spending, not because they
choose to but because they
have to. Thus, now more than ever, the important numbers to watch are those related to employment.
The Labor Department releases payroll numbers monthly (jobs that were added or lost in the previous month) and initial claims for unemployment benefits every Thursday (known as jobless claims) . Let's look at each more closely.
The monthly payroll number is watched very closely, by politicians in particular. This is the number you will hear most about in any campaign: "During my Presidency/ Governorship/Mayoralty, I added X million new jobs". When Clinton said "It's the economy, stupid", this is what he meant and that's people reacted to. In addition, it is the Holy Grail of all macro-based econometric models. Predict the employment number and the rest is dot connection. Wall Street is particularly keen on it because it affects expectations for inflation, interest rates and, of course, consumer demand. In other words, everyone watches and everyone cares. So how accurate is this number?
In a word... it depends. The Bureau of Labor Statistics (BLS) has to deal with intense seasonality, as well as the ebb and flow of businesses opening and closing - the so-called business Birth/Death factor. Seasonality is well understood and follows repeated patterns. However, the Birth/Death factor is very different - this is what the BLS itself has to say about it:
"The most significant potential drawback to this or any model-based approach is that time series modeling assumes a predictable continuation of historical patterns and relationships and therefore is likely to have some difficulty producing reliable estimates at economic turning points or during periods when there are sudden changes in trend. BLS will continue researching alternative model-based techniques for the net birth/death component; it is likely to remain as the most problematic part of the estimation process." (bold added).
In other words, the accuracy of the monthly payroll number is highly dependent on a
"problematic estimation process" - not exactly comforting. The following chart shows the number of new jobs reported by the BLS and how many of them were due to the Birth/Death Model. In 200-06 the model "created" 34-42% of the reported numbers. In the first 11 months of 2007 the model accounted for a
very high 82% of all reported new jobs.
To wit, even as the actual BLS survey showed many fewer jobs being created, their Birth/Death model tacked on and reported an additional 1.1 million jobs, because it is still stuck on "expansion" mode, extrapolating a trend that simply isn't there.
Anyone even slightly familiar with mathematics can see that the discrepancy is so high that the reported numbers are entirely unrealistic and will eventually be revised down. For the same reason, however, we can reach a
highly reliable conclusion: that we are indeed
undergoing an economic turning point, from expansion to slow-down or perhaps contraction. The Birth/Death Model is valuable, after all...
The other employment number the BLS reports is weekly jobless claims. They have been trending higher, as expected in a slowdown, but not spiking up as during a recession. To further adjust for the larger labor force over the years, I charted the ratio of claims to people employed
(see below). The chart tells a story quite consistent with an employment holding pattern: new jobs are scarce, but there are no massive layoffs, either. Notice, however, that we are near historical lows.

Let's put it all together and attempt to answer the original question - when will the mighty US consumer shut off spending? The truthful answer is,
I don't know. But I know where to look for very credible signs preceding the spending cuts:
weekly jobless claims.
I also know something even more important: given the hand-to-mouth existence, high debt and rising inelastic expenses,
significant job losses will lead to deeper and faster spending cuts than ever before. That will be the critical point, not only for the consumer, but for the entire US economy. I'll be watching...


