Thursday, February 28, 2008

Financial Palmistry

This just in from our "cocktail party tricks" department:
Amaze your friends by demonstrating that all they need to know about market excesses during 2004-07, and their future course, can be seen in the palm of their hand.

Here's how...


Hold your hand up as if you were to perform a military salute. Think of your fingers as bars in a bar chart with your palm being the X axis and your fingers rising along the Y axis. See picture below.

Point out that the four fingers are rising smartly above zero and that the thumb is "holding up" the X axis. You'll come to the thumb in a minute; first, identify the other fingers as "stocks", "bonds", "real estate" and "commodities", in no particular order. This was an unprecedented, "Everything Up" situation. As the economy and markets go through cycles, one or two of the "fingers" should be negative, e.g. stocks should rise and bonds drop during an expansion and vice versa, etc.

But not this time. Before the bottom dropped out of the credit market in mid to late 2007, every single "finger" was doing extremely well.

Lets' look at the "fingers" between January 2004 and August 2007 (all numbers approximate).
  • S&P 500: +40%.
  • US High Yield Corporate Bond Credit Spreads: Down from 360 bp to 250 bp (i.e. credit-worthiness way up).
  • Case Schiller Home Price Index: +40%.
  • Goldman Sachs Commodity Index: +33% (as of 1/2008 it is +66%).
How was this possible? It's all about the "thumb": look at the picture again and notice how it is holding everything up. Now let's identify it as "Debt" (though for a time it was ludicrously misnamed "liquidity"), and everything falls into place:
  • Total debt: +35% (includes all sectors, i.e. government, corporate, household, financial).
Lastly, point out to your friends that the "thumb" is now getting crushed from the credit market contraction, then leave it up to them to make predictions for the rest of the "fingers".

Floral gypsy dress (for the ladies) or Johnny Carson-type Carnac The Magnificent turban (for the gentlemen) strictly optional.

Tuesday, February 26, 2008

Lies, Damned Lies and Bond Insurance

Credit insurance was born in the municipal bond business, to take advantage of a quirk: rating agencies apply different rules in assigning ratings to states and local governments than they do when rating corporations. In essence, they rate local governments against each other. If the State of Upper Anchovia is deemed worthy of a AAA based on its finances, then the State of Lower Anchovia with slightly lower financial strength gets a AA, even though it would be worthy of a AAA if it was judged by itself.

The demand for municipal bond insurance came entirely from individual retail investors who wanted the comfort of AAA-insured ratings, thinking them equivalent to Treasurys. Since municipal bonds rarely defaulted, monoline insurance companies made a pretty penny selling unnecessary insurance to unsophisticated investors. It was like selling snow damage insurance in the Sahara, or as P.T. Barnum said, there's a sucker born every minute.

But then the monolines got greedy and jumped on the structured finance bandwagon, insuring all manner of private, asset-backed bonds. There is nothing wrong with wanting to make extra profit, as long as you price the marginal risk/return properly. Clearly, the monolines did not, choosing instead to buy into the financial engineers' elevated assurances about the implausibility of multi-sigma events and the non-existence of black swans. Oh, and the elevated fees must have played a role, too..

So here's my suggestion: The federal government should guarantee all state and municipal bonds - at least those not tied directly to private-sector projects. It will cost next to nothing and save local governments billions in the process, in lower interest and insurance costs. This will leave the monolines with the weak structured finance part of their insurance book, and undoubtedly result in downgrades and large write-offs. But this is the private sector and it can take care of itself, one way or another. The public sector, on the other hand, must be protected from avarice.

Will there be conflicts from the constitutional separation of power between sovereign states and federal government? I imagine so, though I am not familiar with constitutional law. Nevertheless, there is no reason whatsoever to keep subsidizing private speculators through proceeds derived from duping the public in the name of government. The lucrative loophole that arose from mis-rating local government debt must be shut down, once and for all.

The nonsense of paying loan-shark rates (8%-20%) for adjustable-rate local government debt when T-bills are at 2% has gone far enough.

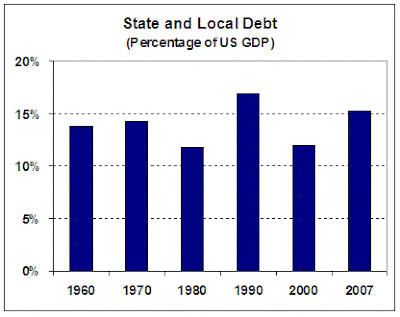
Update: Several readers objected to my guarantee proposal, mentioning that some local governments are badly mismanaged and thus should not have their debt back-stopped by the federal government. Here is a chart of the overall state and local debt as a percentage of GDP.

By comparison to the household and financial sectors, who have sent their debt soaring, local governments have been paragons of fiscal virtue. Cicero (see masthead) would have been proud.

Data: FRB


Sunday, February 24, 2008

Dutch Boy, Finger and Dam, Inc.

What are we to make of the possibility that several banks will try to inject $3 billion into one of the ailing monoline insurers? The news involves AMBAC, which insures $524 billion of bonds, including municipal and structured finance issues. I have some observations:

The effort is all about appearances instead of reality, i.e. preserving the AAA rating for the monolines so that banks' own portfolios of insured securities can still be used at elevated prices for regulatory capital purposes. In today's virtual reality banking it's the nameplate fictitious AAA that matters, instead of the factual reality that exists in the marketplace. In other words, if a CDO has a AAA rating, a bank can still employ mark-to-model methods and calculate a very high virtual price for its balance sheet, instead of having to use a lower factual price (i.e. what someone will pay for it right now).

We can get a sense for this from the Fed's guidelines for acceptable collateral at the Discount Window, which clearly favor AAA-rated issues for CDOs, CLOs and such structured instruments. The same collateral rules also apply to the Fed's current TAF (Term Auction Facility) operations, which have become quite vital in meeting banks' liquidity needs. It is important to note that..."If the margined value of a winning Participant's available collateral were to fall below the amount of TAF Advance awarded to it in the Auction at any time before, on, or after, Settlement Date and before Maturity Date, the Participant would need to pledge additional collateral to cover the shortfall...". In other words, the Fed would issue a margin call.

Let's follow through a bit..

Assume a bank has collateralized its TAF loan with a five year, 5% AAA-insured CDO. Given current rates (5-year Treasury at 2.83%), this bond would be expected to trade significantly above par - if the AAA-insured rating was, in fact, real. Since the CDO doesn't really trade in the secondary market, the mark-to-model fiction is being maintained through the AAA rating and the Fed takes it as collateral at par (minus the haircut).

Now, if the AAA rating were to be cut down to AA or A in a monoline downgrade, the game would be up. The mark-to-model algorithm would have to take into account the alternative credit insurance market (e.g. CDS prices), resulting in much lower prices for the CDO and thus margin calls from the Fed. Pretty ugly.. But this would only be the beginning of the trouble, because in such a downgrade scenario other dominoes start falling, too.
  1. There are many investment pools that can only invest in AAA securities: e.g. many pension, mutual and money market funds. As soon as the AAA ratings are gone they would be forced to sell - imagine the crush at the gates as everyone tries to get out at once.
  2. Bank regulatory capital would be affected, since AAA-insured securities have a much smaller reserve requirement than lower-rated ones.
Not to mince words, banks and regulators want the AAA fiction maintained at all costs. But it is fiction, so reality will ultimately catch up. The AMBAC plan (if it comes to fruition) is only a delaying tactic, meant to maintain the fiction long enough for reality to change back to positive, instead of abysmal. Think Dutch boy, finger and dam... The hope is that the credit storm will end before the whole dam collapses and drowns a large number of the financial system population.

Hope dies last, of course, and the delaying plan may yet work - so who am I to question it? It is just that my experience has shown that in matters financial it is best to deal with reality as it exists today, instead of playing Annie (The sun'll come out tomorrow, Bet your bottom dollar that tomorrow there'll be sun!).

Reality is that there is too much debt versus earned income in the US and many other western countries. There aren't any painless ways out of this fix (certainly not monetary ones), and the pain to correct it must be shared by all: investors must accept some capital losses and significantly lower real rates of return going forward, corporations must accept lower profit margins by boosting wages and salaries (i.e. increase earned income for workers), and individuals must realize that low taxes are a thing of the past.

We got into this mess as separate entities - persons, corporations, countries - each selfishly and separately looking to maximize individual gain. The way out must perforce involve commonality in understanding the problem and cohesion in finding solutions.

Friday, February 22, 2008

The Peoples' Bank of USA

As the credit crisis expands like ripples in a pond, politicians are waking up to the fact that they "must do something". Homeowners upside-down on their mortgages (i.e. they owe more than their homes are worth) are their current focus. The New York Times reports that as many as 8.8 million homeowners may be under water. As I have said in previous posts, the chief driver of mortgage defaults is exactly such a condition, leading to "jingle mail".

Panicked bankers are now all over Washington suggesting ("imploring" describes it better) that the federal government should buy and guarantee their risky mortgages, effectively turning Uncle Sam into the Peoples' Bank of The United States.

Don't you just love it? When times are good, bankers are all for invisible hands, laissez faire and Friedmanite free markets; but let Mr. Market give them a bit of the stick and they turn bolshier than Rosa and Leon (that's Luxembourg and Trotsky, for those less versed in communist hagiography).

Fine, then. The Brits have already shown the way with Northern Rock: if you want your bank rescued you must give up equity ownership proportional to the government's involvement. It's only fair and definitely within laissez faire economics: he who provides the capital gets to own the means of production, no? If the government, i.e. the people, provide the money, then the people should own the banks. And the process has started, anyway: it's the People of Dubai, Qatar, Singapore, China, Korea, et. al. who already own sizeable chunks through their SWFs. Why should Americans be left behind - in their own country, no less?

So, line 'em up boys.. Citi, BOA, Bear, Morgan and - why not - Goldman. To each according to his need and from each according to his worth.

Ain't communism grand?


Tuesday, February 19, 2008

Fidel, The Black Swan

When Fidel Castro threw out the corrupt Batista regime in Cuba (i.e. our bastards) President Dwight Eisenhower said that we should not worry about him much because he would be gone soon. Fifty years and ten Presidents later (six of whom are already dead), Fidel finally decided to step down. As Nicholas Taleb would say, he is a Black Swan.

Fidel: The Political Black Swan

What's the moral of the story? NEVER underestimate what looks like a "contained" situation. Like the subprime crisis.. which begat the credit crunch.. which begat the slowdown.. which begat (?) the recession.. which may beget much worse and for a much longer period of time than conventional wisdom currently expects.

Sunday, February 17, 2008

Un Ballo In Maschera

I have often remarked that I am on the deflation side of the inflation-deflation debate. Here is one more argument in support of this thesis:

So-called "innovative" finance monetized real estate and corporate assets that where hitherto immune from being turned into money equivalents. This was done via an array of asset-backed securities and derivatives which often went all the way to the fourth order. Starting from plain vanilla mortgage, consumer and corporate loans (i.e. funded debt), the investment bank factories synthesized a whole array of artificial goods, ultimately far removed from the income streams of the underlying assets:
  1. CDOs and CLOs, i.e. tranched bonds made up of loan packages.
  2. CDSs on the above bonds, i.e. credit insurance policies.
  3. Hybrid and synthetic CDOs, i.e. bonds made up of the above CDSs.
  4. SIVs that issued their own ABCP in order to buy and hold the above "goods".
  5. CPDOs that were structured to own CDS income streams.
... and more...

The alphabet soup seems thick and opaque, but don't let the jargon confuse you. Here is the crucial point: almost all of these "securities" were unfunded debt, i.e. money equivalents created from thin air. All they did was to generate more and more "buying power" to boost asset prices higher, from houses in the Inland Empire of California to share prices in New York, London and Shanghai. In case it is still unclear: it was margin debt.

If you are familiar with buying stocks or commodities on margin, you can immediately appreciate what went on, and why all current attempts to avert a wider crisis will fail miserably for as long as the focus is on the symptoms, instead of the underlying illness. Margin debt cannot be "restructured" with falling asset prices. Period.

Depending on the leverage used, this debt is now worth anything from zero to a deep discount from face value. And that's where it is trading at, when it trades at all in the secondary market. All those trying to hide the balance sheet reality behind plywood and canvas should be recognized for what they are: Potemkin village builders.

This artificial money is now being removed, destroyed by dropping asset prices. How much of this "margin money" was created, in the first place? In a word, lots. In the end of 2007, financial sector debt amounted to 110% of US GDP, or $15.4 trillion. It was 63% just ten years ago (see chart below, click to enlarge).

Financial and Non-Financial Debt as Percentage of GDP Data: FRB

Allora.. finalmente, it is only fitting that this is happening during Carnevale. The clueless may still be dancing Un Ballo In Maschera, but I already see the elaborate Venetian masks coming off and "Miss Lovely Liquidity" being revealed for who she really is: "Madam Ugly Debt".


Thursday, February 14, 2008

Les Liaisons Dangereuses

Let's say we are mortgage lenders who managed to dodge most of the bullets that killed or maimed so many of our fellow bankers last year. We want to stay in business and keep lending to qualified borrowers, so we must come up with updated lending standards for 2008 and 2009, specifically the down payment required.

The reason we focus on down payments is because research has shown that negative equity (i.e. a house worth less than the mortgage outstanding) is the single biggest factor leading to default. Most models today view mortgages as contracts with attached put options favoring the borrower: when the house value drops significantly below the loan amount the borrower can "put" the house back to the lender and simply walk away (a.k.a. "jingle mail").

In recent years, we have also become aware of shifting social attitudes: debt is no longer viewed as a "moral" obligation, a binding social contract between consenting parties, but as an adversarial relationship between borrower and lender. Therefore, as conservative businesspeople we must also account for a higher probability that borrowers will walk away from their debts, if it suits them.

(This phenomenon requires a discussion all by itself. In brief, I believe it is ultimately the product of leadership failure, the placing of inordinate emphasis on "free" markets and individualism instead of regulation and the development of cohesive social structures. Let me put it in this - admittedly extreme- way: in the jungle no one owes anything to anyone.)

In order to set the down payment percentage required, we must first predict the direction of house prices. In the past, declines were rare, isolated to specific areas and/or lasted for brief periods. Clearly, this is no longer the case; the bursting of the national real estate bubble has changed everything. We must, therefore, come up with some reliable estimate of what house prices will do over the next couple of years. So, we turn to Fannie Mae, the world's largest mortgage buyers, who predict that on top of the 2.2% decline in 2007, house prices will drop another 4.5% in 2008 and 2.6% in 2009. This means that a house we finance today will be priced at 93 cents on the dollar two years out, i.e. our collateral will be worth 7% less.

Based on the above, what down payment will we require to minimize defaults? What kind of error margin are we going to add - if any - on top of Fannie Mae's projections? Will 10% down suffice, or will we ask for 15-20% to be on the safe side? Or will we throw caution to the wind, call it a bottom and try to become the Sultans of Loans by increasing our market share with no-money down loans?

See the problem? The Sultans of Loans model is dead (just ask Countrywide) and the remaining, conservative lenders are increasingly asking for higher down payments. How many savingless Americans can today afford to plunk down 10-20% cash for a house? Let's do some more simple arithmetic:

A two-earner American household has an average disposable income of $70.000/yr. Let's assume they want to buy a $300.000 house and need to put down 15%, i.e. $45.000. Starting from zero, the couple will have to save 5% of their income for 13 years, or 10% for 6.5 years. Compare that saving rate with reality, as shown in the chart below:

Personal Saving Rate

Americans haven't consistently saved 5-10% of their income in decades and are currently at 0%, or even negative saving rates. How will they put together the required deposit for a house?

Ladies and gentlemen of the SuddenDebt S&L Credit Committee,

I am sorry to report that we are in for the long haul in this real estate/credit crisis. It's simple arithmetic... And on this day of hugs and kisses for our loved ones, I have to recommend that hard love is the only course we can take with our potential borrowers. Otherwise, our liaisons will become very dangerous, indeed.

Sincerely,

Val Mont
CEO

P.S. I just got this from our Realtor (R) friends:

The median sale price of a U.S. home dropped 5.8 percent to $206,200 in the last three months of 2007 from $219,000 in the same period of 2006, the realtors group said today. Prices fell in 77 of 150 metropolitan areas, the most since the group began tracking values in 1979. The decline was 10 percent or more in 16 metro areas, the association said.

Val


Wednesday, February 13, 2008

Suspended Animation

Markets seem to be in suspended animation mode, zipping and getting zapped by a variety of relevant and irrelevant newsbits, rumors and wishful expectations. The latest were Mr. Buffet's offer to assume the monolines' municipal bond insurance books and the agreement between a group of banks to freeze home-owner foreclosure actions for 30 days.

They are both "no-brainers"..

Of course, Mr. Buffet wants the muni insurance business! It's the profitable cream which, if removed from the monolines' books, will leave them with the rapidly souring structured finance insurance business, hastening their demise. The sly old gentleman does not expect the ailing insurance companies to accept voluntarily; he's just placing a marker on the table, for the event that monolines go under and their municipal business has to be transferred to other insurers - for example, his own recently formed credit insurance company.

In the meantime, credit risk for corporate bonds keeps going up and up, even for investment grade names.
CDX Investment Grade Index (Chart: Markit)

As for the 30-day "freeze" plan, it's a delaying tactic in anticipation of further deep Fed interest rate cuts, which could ease some of the pain in the upcoming wave of adjustable rate mortgage resets. The initiative's name is straight out of Depression Era programs: "Hope Now". Now, it looks to me, Hope is the only thing being offered to the desperate investors who see the value of their "creature feature" securities plunge deeper and deeper into the toxic waste dump, from which they initially arose...and Hope dies last.

So far, attention has been focused almost exclusively on banks' holdings and their write-offs, amounting to some $130 billion. But this is a small part of the problem; after all, banks acted as intermediaries, packagers who funnelled the merchandise to the ultimate buyers: pension, mutual, hedge and private equity funds, plus SIVs and corporations who parked their cash there. In other words, the banks' holdings were the leftovers and the rotting main course is still to be accounted for. Only a few foul whiffs have escaped so far, as a small number of non-financial corporations took charges against fourth quarter 2007 earnings to write down losses in their holdings.

There is more to come. According to SIFMA, a total of $1.5 trillion in CDOs alone were issued globally during 2004-07.


Saturday, February 9, 2008

Space Oddity

Securities margin debt (chart below, click to enlarge) is the booster fuel that always kicks in late in a bull phase. Market astronauts borrow freely, certain they will send their portfolios to the Moon. Such "lunatic" phenomena commonly foreshadow the exhaustion of upward momentum and a return to terra firma. Depending on the exuberance previously exhibited, the terra can be very firma, indeed, for those unwise enough to still occupy their spent rockets as they hurtle back to Earth.

Updated chart: Some readers asked to see the chart in log scale. I think most non-technical people do not quite "feel" a log chart, so I did the next best thing: I added an exponential trend line for comparison purposes (red curve).

Data: NYSE, updated to 12/2007

Observations related to the above chart:
  1. In the first "vertical" period (1/99 - 3/00, margin debt +63%) S&P 500 rose +35%.
  2. In the second (8/06 - 7/07, margin debt +69%) S&P 500 rose +26%.
The latest Market Moonshot required more debt fuel and went less distance, even when compared to the historic dotcom bubble. If I were the flight ops director I would be concerned.

In the words of David Bowie's classic song:

Though I'm past one hundred thousand miles I'm feeling very still
And I think my spaceship knows
which way to go...

Ground control to Major Tom
Your circuits dead,
there's something wrong
Can you hear me, Major Tom?

Friday, February 8, 2008

Commercial RE Lending Risk Soaring

Credit risk for commercial real estate loans has been soaring recently. Yesterday rate spreads for every single series in Markit's CMBX index (there are 27) rose to new all-time highs. Even the AAA tranches have now reached 200+ bp (2%) over, coming from lows in the single digits just six months ago.

CMBX AAA Series 3

The low grade tranches (BB and BBB-) are closing in on the 2,000 bp level (i.e. 20%), while the BBB tranches - considered investment grade - are topping 1,400 bp (14%).

CMBX BBB Series 3

This is clearly the next area where significant loan writeoffs will take place in the financial community.

For the economy, these developments could not come at a worse time. Private non-residential building activity reached $350 billion last year (up 18.3% from 2006), while residential building declined to $524 billion (down 18.2% from 2006). Thus, total private building activity - residential plus non-residential - managed to drop only -6.7% versus 2006.

This explains why construction jobs remained solid in 2006 and the first months of 2007, but are now dropping fast. If commercial building slows down significantly from here, as seems likely given the financing prospects, then the overall job picture will darken even further.

Total Construction Jobs (Chart: BLS)

The last construction boom created many more jobs than before. Given the depth of the bust, I wouldn't be surprised to see around 2-2.5 million jobs lost in the sector, to bring us back to trend. The 1990-91 recession saw a loss of 16% of construction jobs; the same percentage today would result in a loss of 1.2 million jobs.

Wednesday, February 6, 2008

Won't Lend, Won't Borrow, No Time For Sorrow

The Era of Debt is coming to an end (for now, anyway...).

The Fed's latest Senior Loan Officer Opinion Survey (January 2008, pdf document) vividly demonstrates that a one-two punch is being delivered to credit expansion: lenders are furiously tightening lending standards and borrowers don't want to borrow. The following charts are from the above survey and tell the story succintly.

First, residential mortgage lending:

Net Percentage of Respondents Tightening Standards
For Residential Mortgage Loans


Net Percentage of Respondents Reporting Stronger Demand
For Residential Mortgage Loans

Next, commercial real estate credit.

Net Percentage of Respondents Tightening Standards
For Commercial Real Estate Loans


Net Percentage of Respondents Reporting Stronger Demand
For Commercial Real Estate Loans


Consumer loans...

Net Percentage of Respondents Reporting Increased Willingness
To Make Consumer Installment Loans


Net Percentage of Respondents Reporting Stronger Demand
For Consumer Loans

The picture is the same for corporate and industrial loans, albeit slightly less "crunchy" so far.

Net Percentage of Respondents Tightening Standards
For C&I Loans


Net Percentage of Respondents Reporting Stronger Demand
For C&I Loans

The Borrow-Spend-Grow economic model was never in the best of health, to begin with; the charts now officially proclaim it clinically dead. It is time for the attending physicians and the relatives to realize that they won't revive their patient by increasing the dose of the same medicine. Better to pull the plug and focus on the "maternity ward", instead. That's where the new economy will come from.

It's no time to wallow in sorrow about the dearly departed asset inflation economy. Let's move on: Save-Invest-Sustain.

Tuesday, February 5, 2008

The Fear Factor (2)

Continuing a bit from yesterday's post on The Fear Factor (i.e. risk aversion), I calculated corporate credit spreads for AAA and BAA bonds vs. the 10 year Treasury. I then divided these spreads with the yield of 10 year Treasurys, to obtain a ratio of the spread as a percentage of the Treasury's current yield.

This gives us a sense for the "effective" credit spread, i.e. how much upside in income a potential investor gives up by choosing a government bond instead of a corporate bond. It's one thing to give up an extra 100 basis points when rates are 10% and another when they are 5% - the effect is double in the second case. The results are charted below (click to enlarge).


Data: St. Louis Fed

The ratios have shot up faster than ever before and are nearing all-time highs; investors are spurning higher yields and instead seek the safety of Treasury bonds. Return of principal is taking priority over return on principal.

In addition, AAA and AA corporate bonds have become endangered species over the years, as debt replaced equity in balance sheets and overall credit quality deteriorated (how many AAA or AA corporate names can you think of?). Markit's CDX Investment Grade credit default swap index for North America is made up 53% with bonds rated BAA, 42% rated A and just 5% rated higher. This makes BAA bonds a better benchmark for "real economy" credit spreads.

Intra-corporate credit spreads between BAA and AAA bonds vs. Treasurys have also shot up sharply (chart below, BAA yield minus AAA yield, divided by 10 year Treasury yield).

Another sign of risk aversion is the sharp rise in credit spreads for higher-risk corporate loans used for LBOs and such leveraged takeover activity. Spreads for Markit's LCDX index have jumped from 310 bp to 460 bp in less than one month.

Chart: Markit

Now, there are two ways to interpret the charts: if you are a contrarian, you could say that risk aversion is overdone and will soon recede, resulting in all manner of rallies in financial markets. Or... not.

Personally, I think risk aversion is the new paradigm and will persist. Readers of this blog sporadically report hearing their friends "confessing" they are lowering debt; an article in today's NY Times comes to confirm this:

...But now the freewheeling days of credit and risk may have run their course — at least for a while and perhaps much longer — as a period of involuntary thrift unfolds in many households. With the number of jobs shrinking, housing prices falling and debt levels swelling, the same nation that pioneered the no-money-down mortgage suddenly confronts an unfamiliar imperative: more Americans must live within their means...

...The shift under way feels to some analysts like a cultural inflection point, one with huge implications for an economy driven overwhelmingly by consumer spending.

_______________________________________________

P.S. December real retail sales in the Eurozone dropped 2% from last year. Biggest declines occurred in Belgium (-6.9%), Germany (-6.7%) and Spain (-1.8%). Is it necessary to point out that Germany is the world's third largest national economy?

Chart: Eurostat

P.P.S. The January ISM Non-Manufacturing Index was just released and it was downright horrible: 41.9 vs. 54.4 in December. The index tracks prospects for the service economy, i.e. 90% of US GDP. As a diffusion index, readings below 50 signify contraction and vice versa.

The drop was the largest ever since ISM started publishing the index in 1998.

Data: St. Louis Fed


Monday, February 4, 2008

The Fear Factor

Yields for two year (blue line) and ten year (green line) Treasury securities have plummeted in recent weeks and today stand at 2.07% and 3.59% respectively (see chart below, click to enlarge). These levels were last visited in 2002, when Fed funds (red line) were already at 1.75% and on their way to 1%, a real rate so negative that it generated the largest, most participated-in capital misallocation in the history of finance: the US real estate bubble.

Chart: St. Louis Fed

The economy has come full circle: the popping of the housing bubble brought us back to where we started six years ago. Nothing was really accomplished in the intervening years, except the creation of another wealth-devouring black hole. In 2000 it was dotcoms and telecoms, today it is millions of homes sitting unsold or in various stages of repossession. And there is no better proof of deflated excess past, than Microsoft's current $45 billion takeover bid for Yahoo, which in early 2000 was worth over $160 billion.

So, are we now paving the way for the creation of yet another debt-financed asset bubble? Is this what today's low interest rates are predicating? Perhaps, but I don't think so.

For one, I don't see the assets that can be pumped up. Commodity ownership is so narrowly concentrated that the wealth effect can't be dispersed into the wider economy. Dubai, Calgary and Perth may be doing fabulously well, but they are mere droplets in the global bucket. Higher material prices also feed the goods-inflation monster at a time when consumers have limited spending power. What higher commodity prices give to the Arabs, Canadians and Australians they take away from the Americans, Europeans and Chinese. It's a win-lose game and as producers and speculators get too greedy, it will end up lose-lose because income and savings constricted consumers will necessarily clamp down on their spending.

Instead, I think low interest rates for Treasurys reflect fear, specifically fear of a deflationary spiral in credit and asset prices. How else to explain the now negative spread between the yield on 10-year Treasurys (green line) and CPI inflation (red line, see chart below) ?

Chart: St. Louis Fed

Negative real 10-year Treasury rates are extremely rare. Perhaps they are telling us something else about fear, too - or, rather, the same thing expressed in a different way: that after many years of positive returns, borrowers now can't put the money to profitable use generating returns significantly above inflation, so demand for credit is evaporating. This includes all long-term asset buyers who finance their purchases with debt, from businesses investing in plant and equipment or buying back stock, to people buying homes.

Therefore fear, or risk aversion as it is properly called in finance, comes in two versions: the first one is fear of lending, which results in tighter credit conditions by banks and other lenders. It comes and goes with the regular business cycle and, in the greater scheme of things, is not uncommon. The second one is fear of borrowing and it is very uncommon; I believe the only instances we have experienced in modern times are the Great Depression and Japan. If both of them ever come together, we may get a "perfect storm" where credit expansion goes to zero, or even turns negative.

It is hard to imagine that a situation would ever arise where lenders are unwilling to lend and borrowers unwilling to borrow, at the same time. The main reason is that usually those two classes are separate and have different interests. They are brought together by professional intermediaries, i.e. bankers who profit from matching the two in an appropriate fashion that benefits everyone. Yet...

I won't elaborate further, but I have the sneaking suspicion that the shadow banking system of originating, securitizing and widely distributing debt (chop and shop?) has turned those two classes into one super-class that may very well obey Polonius's maxim: "Neither a borrower nor a lender be".

_____________________________________
P.S. Breaking news from Reuters:

Bush's $3.1 trillion budget proposal would nearly freeze domestic spending in fiscal 2009.

This is exactly unwillingness to borrow, writ as large as can be.

Saturday, February 2, 2008

Painting Stories: In Memoriam Moe

The virtual ink hasn't yet dried on the FOMC's one-two punch of rate cuts (125 bp in 8 days) and the "market" is back calling for more. According to the Fed funds options market, the probability of a cut in March is 90%, with the chance of a 75 bp cut rising to 30% - equal to that for a 25 or 50 bp cut (see chart below).


In contrast to Greenspan's previous gradualism (he rarely moved by more than 25 bp), the Fed's current actions reflect Mr. Bernanke's choice for an aggressive monetary style, shaped by Milton Friedman's theories and his own academic work. Both interpret the Great Depression as the result of hesitant monetary policies in the face of financial market turmoil, instead of unsupportable asset bubbles and severe socio-economic imbalances in income and wealth.

The outcome is that the Fed now pays much more attention to financial market behavior than anything else. Indeed, the latest FOMC announcement could have been written by a broker's investment policy committee; the very first sentence after announcing the new rates is: "Financial markets remain under considerable stress...".

I won't expand on the danger of thus getting caught in a knee-jerk spiral of policy action - reaction, but focus instead on the quality and significance of market data, used to inform the Fed's market-driven decisions.
For example, who determines the option prices that are used to calculate the probabilities shown above, and which are then interpreted by the Fed as "the market expects us to..." ?

In other words, who's "painting" the picture that the Fed sees? Let me tell you a story...

When I was starting my career in finance I had the great good fortune to sit next to an old gentleman who started working in Wall Street one month before the 1929 Crash. In an uninterrupted career that spanned decades - he only stopped to fight in WWII - he made and lost several small fortunes and finally learned enough to become comfortably rich.

When I met him, Moe was well past retirement age and didn't have to work for a living, but came to the office daily anyway. As he succintly put it: "What else am I going to do?". He was happily married to a gracious and elegant lady, so the the usual excuse of avoiding marital distress didn't apply; perhaps being out of the house kept it that way... In any case, Moe's position in the firm was assured by tradition, honor and, I suspect, not a little fear of the age discrimination laws. Upper management kept hinting he should retire voluntarily - they gave him a gold watch, twice - but he just shrugged them off. And kept the watches.

I learned a lot about markets from Moe that isn't to be found in any formal training course or book - save the classic Reminiscences of A Stock Operator, which he could have easily written himself, anyway. He didn't share financial theories, analyses or models with me, just hard practical facts about people and how to battle for a buck on the Street. (He also told me stories about Ziegfeld girls, but they can't be repeated here.)

One morning, he glanced over his newspaper and saw me poring over the double tome of Daily Graphs. "You see anything in there you like?", he asked. Naturally, I was flattered and started spewing out the usual gobbledygook about technical formations, indicators, angles and the like. He listened patiently. When I finished, with what must have been the look of a puppy expecting a treat on my face, he said: "Let me tell you a story".

"When I was about your age and full of piss and vinegar, I too looked at charts, thinking I could figure it all out by looking at pictures. One day, I even approached a big speculator and solicited his business by recommending something out of a chart. He asked me what I saw and I told him all about the picture - the same as you just did. When I finished, the guy gave me a shark smile and said, "Son, I'm the guy painting the picture you're looking at - now git". Moe stopped right there and went back to reading his newspaper.

I have never forgotten Moe, rest his soul. He comes to mind every time I see a chart, an analysis or a particular "action" in a market. For instance, when I look at the above Fed fund implied probabilities, I wonder... Who exactly is doing the "implying"?

And I also wonder...has Mr. Bernanke ever met a "Moe"?

Friday, February 1, 2008

"The Greenback" - A Thought Experiment

Today I will pose a thought experiment*.

The money supply of the United States shall be indexed to the production of renewable energy and the "dollar" shall be renamed the "Greenback".

Potshots invited.
____________________________________________

Some further information:

Our world is facing two fundamental and interlinked challenges: fossil fuel depletion and global climate change caused by greenhouse gases. These are monster issues and lurk behind each and every major political, economic and strategic decision, from revamping transportation infrastructure to overhauling pension systems and making war.

While there are still entrenched interests that wish to muddle the issue, the Chairman of Shell Oil has just released a statement which begins:

By 2100, the world’s energy system will be radically different from today’s. Renewable energy like solar, wind, hydroelectricity, and biofuels will make up a large share of the energy mix, and nuclear energy, too, will have a place.

Further down, he states:

After 2015, easily accessible supplies of oil and gas probably will no longer keep up with demand. As a result, we will have no choice but to add other sources of energy – renewables, yes, but also more nuclear power and unconventional fossil fuels such as oil sands. Using more energy inevitably means emitting more CO2 at a time when climate change has become a critical global issue.

____________________________________________________
(*) This is a proposal I made some time ago in a comment to The Oil Drum. It was in response to calls for the re-instatement of the gold monetary standard, which I regard as ill-suited to an era of resource depletion and climate change.