Thursday, September 30, 2021

The US Economy: Is It A Couch Potato?

 The US is certainly the world's largest economy - but is it the healthiest? Today, just one chart says it all.

The Fed's balance sheet was a lean 6% of US GDP in 2008.  Then the Credit Bubble collapsed and the Fed had to step in to avert a total meltdown of America's financial system and a repeat of the Great Depression. It bought Treasurys and other securities (mostly mortgage-backed bonds), fattening its balance sheet to 18% of GDP.  But it wasn't enough. Though the immediate crisis had passed, the US economy wasn't really on solid footing, so the Fed kept pumping and buying assets up to 25% of GDP in 2015.  

Eventually things settled down, the economy recovered and the Fed eased back to 18% of GDP at the end of 2019. Mind you, 18% was still huge by any historical monetary/fiscal fitness standards.

Then the pandemic struck and the Fed threw all caution to the wind - its balance sheet assets exploded and are now at an obese 35% of GDP (2Q21 data) - see below.. 

The Fed Goes El Gordo 

What does this really mean? 

The Fed's assets are bonds: Treasurys, corporates, mortgage backed (MBS) and municipals (bonds issued by local governments). Therefore, the chart shows that the US economy is currently financed to a very, very great extent by its central bank.  And where does the central bank get the money to buy the bonds? Simple: it creates dollars entirely out of thin air, trusting (hoping?) that Americans and the rest of the world will continue to have faith in them. That's what I call faith-based financing - the American economy is now faith-based. "In God we trust", the motto printed on every dollar bill, now has literal meaning.

How healthy is the American economy? I don't know about you, but when I see an economy that floats on a rapidly rising sea of faith-based dollars, I worry about what will happen if this faith suddenly evaporates.

Let me put it in medical terms: a lean individual who eats right and exercises regularly has very few chances of getting a heart attack. But if he becomes a couch potato, puts on a lot of weight, eats burgers, fries and shakes every day, then he is a prime candidate for a sudden heart attack. And if he also believes/hopes that everything is fine, regardless... then he really has a death wish.

Interestingly, there is solid scientific evidence that such biological/social behaviour explains the rapid decline of empires (thanks to loyal reader AKOC for the link). Here is a quote from the article:

Most disturbingly, Dr Penman sees exactly the same process as taking place in our own age, but at a “far more accelerated rate” because of the West’s greater prosperity. The effects are already being seen in economic stagnation, a growing gap between rich and poor, and a collapsing birth-rate.

Wednesday, September 29, 2021

Modern Monetary Theory - This Nonsense Goes Back To Ancient Rome

 I saw the table below on Modern Monetary Theory in a Bloomberg article. If you don’t care to examine it closely here is a one line resume:

=> Print as much money as you want and just give it away, there are no consequences.


I’m willing to bet that this was what Roman emperors thought as they continuously debased their silver denarius, the most common coin in circulation. 

In 35 AD Tiberius struck a denarius that was approx. 98% silver. Its exchange rate to the solid gold aureus coin was 25 to 1. 

By 356 AD during Julian’s reign the denarius had been progressively debased to less than 5% silver and its exchange rate had collapsed to 4.600.000 denarii per gold solidus (it had replaced the aureus). Annual inflation was running at 1000%,  the denarius had lost 99.99945% of its original value.


Which, I guess, is precisely why former Bank Of England chief economist Andy Haldane says that modern monetary theory is neither modern, nor monetary, nor a theory.

Denarius, dollarius…. Meh…  liquidity is all so much water under the bridge. Let’s hope we don’t all drown in it.

Tuesday, September 28, 2021

Inflation About To Step On The Gas: Perfect Storm Brewing?

With natural gas prices soaring, is consumer inflation about to soar too? Yes, of course.

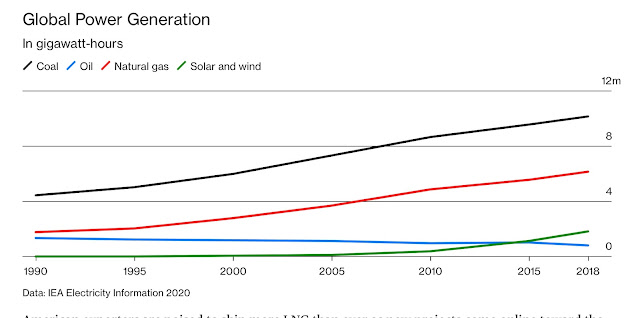
Natural gas is used everywhere: power generation, heating, transportation, agriculture, metal and chemical production.  It is very deeply entwined into the life of all consumers who, for the last 15+ years at least, didn’t have to worry too much about its price affecting their pocketbooks and living standards. 

This is about to change, and radically so - see chart below.


The price for natural gas in Europe has exploded to unprecedented highs, more than tripling in just a few months. Very sharp hikes are already occurring in wholesale electricity prices, and many providers, particularly in the highly privatized and deregulated UK, are going out of business. Politicians are praying for a mild winter, but prayer does not make for good policy.


How will a sudden tripling of natural gas prices affect consumer inflation? We can look at history for a guide. 

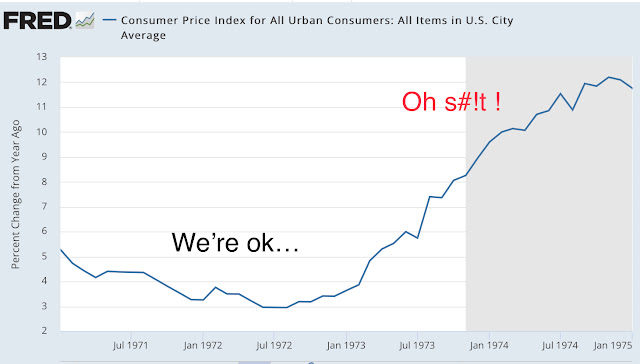
Back in 1973 crude oil was used everywhere, just like natural gas today. Believe it or not, natural gas was mostly considered a waste product and commonly “flared” on site (burned near the oil wells).  When the Arab-Israeli conflict escalated into war, oil producers used oil as a weapon against the West and jacked up prices suddenly from $3/bbl to  $10/bbl - see below.


Consumer inflation followed suit, going from 3% to 12%, bringing about a deep recession - see below.


Will 2021-22 be a repeat of 50 years ago? If we judge by what is going on now in the UK (petrol stations shutting down due to supply "imbalances") and China (widespread gas and electricity rationing is  closing factories, reducing shopping hours and resulting in city brownouts), it is already happening. China's power rationing is certainly going to have a very serious global impact on the supply of all consumer goods, from T-shirts to Teslas. Like I said, gas is everywhere..
 
And now there is A LOT of fuel for an inflation  conflagration.  Money supply is simply through the roof, with M3 going from $15 trillion to $20 in 18 months  - see below.


 Is the bond market reacting? Given the constant manipulation by the Fed and ECB it is not easy to see the reaction - but it is happening.  Just look at the 2-year Treasury yield making new 18 month highs.


Oh, and there is that pesky Debt Limit situation going on, too. Yesterday, the Senate rejected the Biden government's plan to, basically, ignore the debt limit until December 2022.

There may be a Perfect Storm brewing out there for financial markets.

Monday, September 27, 2021

The World Is Shifting Left

 The world is shifting left/green politically. Here’s proof:

Item 1 - The German Elections 

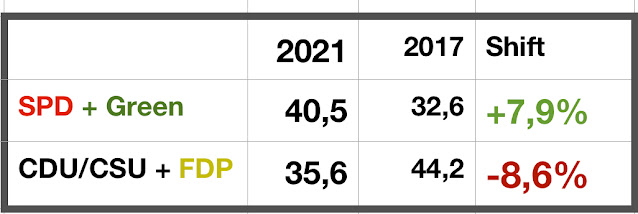
Go past the headlines and yesterday’s German election results are crystal clear: the country’s voters are moving left of center, with significant gains for the Green Party in particular. Angela Merkel’s conservative CDU/CSU had its worst showing since its founding right after WWII.

The shift becomes more obvious when we exclude the far right AfD and far left Die Linke parties and look at the results for the two blocks: conservative [CDU/CSU + FDP] versus progressive [SPD + Greens].  The table below tells the story. 

To a large degree the shift comes from young under-30 Germans who voted for the Greens en masse (around 32%) and completely spurned the conservatives (around 11%). Change is definitely in the wind in Europe’s largest economy. 


Item 2 - USA

Though European and American politics are very dissimilar (it’s like comparing American football with soccer,  the “real” football), things are on the move in the US, too.

Alexandria Ocasio-Cortez  and Bernie Sanders are enjoying tremendous, mainstream popularity. Like in Germany, they are particularly popular with young Americans.

 
They are now among the most popular mainstream American politicians, ranking #6 and #7. But if we exclude Carter, Obama and Schwarzenegger who are no longer active, they rise to #3 and #4.  When was the last time that left-leaning, progressive politicians were so popular in America? In FDR’s time, and his opponents called him a communist!


Item 3 - China

In case you haven’t noticed, China has recently shifted its socioeconomic policy, moving away from a winner-take-all free market capitalism to what Xi Jingping calls Common Prosperity. Notice the Common part, ie as opposed to the creation of individual billionaires.  The party has clearly shifted gears towards its ideological foundation (Marxism) as a tool for the creation of a large thriving middle class.
The signs are everywhere, from the dismantling of Evergrande’s empire (more are certainly coming) to stomping on Macau’s foreign-owned casinos. 

Bottom line: the world’s #1, #2 and #4 economies are shifting left. Their combined GDP is $44 trillion or 52% of the world’s total. Yes, I think we can safely say that the World is shifting left.


Sunday, September 26, 2021

Corporate Taxes Set To Triple

 Looking at the Federal Budget data documents directly is always revealing because it avoids being blindsided by political blah blah and media spin.  Just the facts, no BS.

I looked at corporate tax revenue from 2014 to now and the projections for the immediate future. Then I made the following chart. This is what the current government is planning to do:

  • Triple corporate tax revenue from $212 billion to $648 billion in FY2024
  • Corporate tax revenue is budgeted to rise from 1% to 2.5% of GDP

(In case you are wondering about individual income taxes, they are also budgeted to rise from $1.61 trillion to $2.29 trillion, or from 7.7% to 9.0% of GDP)


Looking at corporate taxes from a longer perspective, the budgeted 2.5% of GDP for FY2024 is the highest since 1979 - excluding 2006-07 when the financial sector had record profits during the Great Credit Bubble (that didn't end too well...).

The era of low taxes is over, clearly. This is the Biden administration's plan, anyway.

Corporate Tax Revenue As Percentage Of GDP

Given that the effective tax rate is currently at 14%, the lowest level in history, the Biden budget is effectively calling for it to at least double, taking it back to the levels of the early 1990's.

Right now S&P 500 is trading at 35 times after tax earnings. The only time P/E was higher was when financial sector earnings collapsed during the Credit Bubble implosion (ie huge losses dragged down average earnings)  and at the top of the dotcom madness - see below, notice the scale is logarithmic.


  S&P 500 12-Month Trailing P/E

So... equities trading at record P/Es at the time when the government is budgeting a tripling of taxes. Hmmmm....


Saturday, September 25, 2021

Show Me The Money

The Fed’s reverse repo just hit another new all time high at $1.33 trillion (that’s trillion with a T not billion with a B, let that sink in). Since the interest rate is 0.05% annualized, the Fed pays $665.000.000 annualized to banks and funds who park their money there. Not exactly spare change, eh? And why does the Fed do that, pray tell, since it is still pumping out $120 billion per month in QE? The mind boggles.

The Fed (ie basically the taxpayer) is giving out money for free and then allows those who receive it to give it back at a guaranteed markup. Oh, but it gets better (umm… worse, actually). The way you get the Fed to give you the money in the first place, is that you put a bunch of mortgages together, create an MBS (at a mark-up, of course) and sell it to the Fed.  The whole operation is, of course, chock full of fees accruing to you and, essentially, risk free. Hey, nice work if you can get it, no? 

And oh, yeah, there’s so much demand for this nice little money-making machine that the Fed just doubled the amount it will accept per counterparty for the reverse repo. And the QE keeps pumping… it’s nuts!!

But that’s not my main topic today. Keep reading..

The Fed’s Reverse Repo Hits Yet Another All Time Record

The government borrowed a bunch of trillions in the past 12-18 months and stuck them into its account at the Fed, called Treasury General Account. It has now spent almost the entire cash pile, taking the TAG balance down from $1.8 trillion to a mere $200 billion - see below. The two charts are, quite obviously, reverse images of one another.


The Treasury’s General Account Drops To $200 Billion

Let that sink in, too: the government’s cash reserves are now just $200 billion. We know that its monthly deficit is an average of ca. $150-160 billion (outlays minus receipts), of which some $25-30 billion is interest on debt alone.  
 
Where’s the money going to come from?  Show me the money!! Normally, the government just borrows by selling bonds - but the debt limit has now been reached; so, no more bonds for now.

Therefore, unless the debt limit is raised rather immediately - as in now! - the US federal government is going to shut down next month and stop paying  Democrats and Republicans are at complete loggerheads on the issue.
 
The Republicans are swearing up and down that they won't vote to raise the limit because the Democrats want to attach an amendment to increase social spending by at least $1 trillion. This requires at least 60 votes in the Senate, where the Democrats only have 50 votes. Gridlock..

The Democrats could vote it in by themselves with 50+1 votes (the VP vote), but only if the Republicans don't filibuster.
 
Hmmmm…. Maybe read again yesterday’s post on US defaulting?


Friday, September 24, 2021

Maybe We Should Rethink What We Know For Sure

The Evergrande crisis is bringing back memories of 2006-08 and comparisons with Lehman’s collapse. Since I had a front seat to the Great Credit Bubble, I have a few observations.

The Credit Bubble of 2006-08 and the crash that followed were pretty easy to identify and to predict. I did it, and I’m no genius. All it took was some common sense and a bit of research. Not serious scientific research - finance is not quantum physics - just data put together from sources easily accessible to everyone.  So, I looked; it was immediately obvious that residential mortgage lending had gone from a boring workaday business to a free-for-all, involving piles of obscure ultra leveraged derivatives.

The immediate culprit, over-leveraged real estate, led to a collapse that was easily understood and affected  the wider public. I mean, everyone understood real estate and mortgages, even if they had no clue about MBS. CMO, CDS, CDO and the rest of the derivative alphabet soup. 

The collapse immediately spread to the banking/financial system for a very simple reason: everyone trusted that a AAA or AA rated CMO or CDO meant it was gild-edged. In fact, it was an artificial construct that depended on very spurious assumptions.  Basically, most of them were little pieces of mortgage bird$#it that were put into a pot, stirred vigorously and…. Voila, they were magically transmuted into foie gras. It was called structured finance and financial engineering; in fact, it was greedy loony alchemy.

Mark Twain said it ain't what you don’t know that gets you into trouble. It's what you know for sure that  just ain’t so”. In 2006-07 everyone knew for sure that they were buying expensive duck liver. 

Before the Credit Bubble collapsed, everyone knew for sure that residential mortgages just didn’t default much - right? But then, defaults soared - see chart below.  The assumption upon which all those alphabet soup securities were based was wrong, so they all came crashing down like blocks in a Jenga game.


 Delinquency Rate Of House Mortgages

Today, despite Evergrande’s troubles it is not really possible to point a finger to a single overpriced and over-leveraged asset class. Yes, there are NFTs and meme stocks that are priced absurdly, but they are not going to produce a systemic shock on their own. A can of “trading sardines” selling for $1 million won’t create a domino effect (see bottom of today’s post for an explanation). I think that while Evergrande may be in big trouble, it is pretty isolated. Crucially, it has not generated hundreds of billions in ultra leveraged credit derivatives which could annihilate bank and insurance company balance sheets all over the world. Evergrande is not Lehman. But something else may be an even bigger problem. 

Back to the present: what is the biggest assumption that we make in markets? What is it that we all know for sure?

The US is rated AAA/AA+ and will never default, right? 

The US government has never defaulted. Its bonds are considered ultra safe and act as the foundation of our global dollar-based monetary system. We know that they are safe, so we use them everywhere, from banking to pension fund assets. We also use them, one way or another, as benchmarks for just about every other financial product in existence. Treasurys are very, very deeply and widely interconnected with our global economic system. We take them for granted.

So, how safe are Treasurys, really?

Let’s start with the basics. Proper debt service is based on two things: 

  1. The ability to easily cover interest payments.
  2. The ability to easily refinance.
Highly indebted borrowers are riskier and  must pay higher interest rates and/or borrow less than they need. How is the US doing? Federal debt is now at 125% of GDP, just about the highest ever. But that by itself is not enough to spell trouble. 

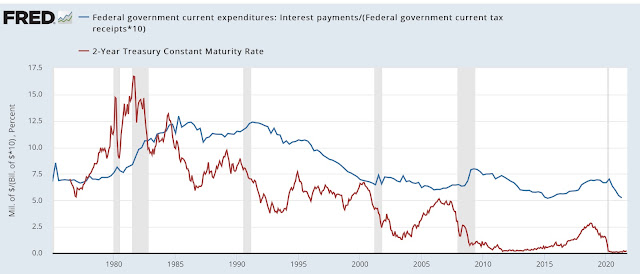
Let’s look at interest payments as a percentage of tax receipts. They have varied in a tight range between 5-7% for the last 20 years. But, today's 5% is not really as comfortable as it may seem because  interest rates are near zero - see below.  The US is still paying a chunky piece of tax revenue to cover interest payments, even though interest rates are near zero. What will happen if/when interest rates go up?

Point A: The US is very vulnerable to an interest rate increase

US Annual Interest Expense As % Of Total Tax Receipts (blue line)
Two Year Treasury Note Interest Rate (red line)

Another way to assess debt viability is to look at the ratio of total debt to annual tax receipts. It started rising in 1980 from 2.5x to around 7x in 2005, but then soared to 10x in 2010 as the government borrowed heavily to salvage the economy from the 2006-08 Credit Bubble. Dealing with the pandemic has now taken the ratio even higher to around 12x. If the government was a business, we would say that its debt load is 12 times its EBITDA, a very high multiple, indeed. For example, the S&P500 is around 2-3x, although that's nor a very relevant comparison; still, it provides a sort of yardstick.
  • Point B: The US federal govt. is very highly indebted versus its income

Federal Debt/Annual Tax Receipts

Another way to look at US debt service is how much money is left over to cover interest payments after basic expenses are paid, eg salaries. For Fiscal Year 2022 the government projects receipts of .$4.12 trillion and outlays of $6.01 trillion. The budget deficit is thus estimated at $1.89 trillion. It was much worse for FY2020 due to COVID, but even so the 2022 deficit will be enormous by historical standards.

US Federal Budget Balance

Salaries and national defense outlays for 2022 are budgeted at $4.86 trillion.  In other words, just paying for those two wipes out all revenue: $4.12-4.86 trillion = - $740 billion. The US is running a huge deficit before interest payments, ie it has a very large primary budget deficit. Outlays for interest for FY22 are estimated at $305 billion and will obviously have to be covered by more debt. Again, if this was a business banks would be very leery to lend.

  • Point C: The US cannot cover interest without going deeper into debt, or slashing expenses and/or raising taxes significantly

Finally, are investors taking all of the above into account when lending to the US? Yes, to a limited extend they are getting more cautious. The "purest" way to look at default risk is through Credit Default Swaps (CDS). As of yesterday, the US is ranked #9 as a credit risk, below even Belgium and just a notch above Ireland (higher CDS prices equal higher default risk).

5 Year Sovereign CDS 
 
 
It is interesting to note that US CDS prices have come up 32% in the last month alone.

Putting it all together....

Never mind Evergrande, maybe what we know but just ain't so is that the US cannot default. Or at least, that its debt is priced at a level that does not adequately reflect the risk of default. Given the upcoming debt limit process and the highly polarized political scene in Washington, we should maybe rethink what we know for sure.

————————————————-

The following was posted originally on Nov. 2, 2009

The Trading Sardine

Andy convinces Billy to buy a can of sardines at a high price by telling him how wonderful they taste. Billy, being greedy, decides to resell them to Charlie for a profit at an even higher price by convincing him, too, about how great these sardines are. The process is repeated several times until the last buyer, let’s call him Zebediah, pays a million bucks to Yorick for a can of the “world’s absolute best sardines – EVER”.

Well, Zebediah decides to open the can and eat the sardines, only to discover they are ordinary, plain sardines. Furious at being swindled, he yells at Yorick: “You crook! You liar! I paid you a million bucks for plain ordinary sardines. They were not the greatest tasting sardines - EVER”, yells Zeb.

Yorick shrugs and replies…

“Hey Zebediah, you are such a schmuck. Those were not eating sardines – them were trading sardines!"

Thursday, September 23, 2021

Evergrande As Lehman? No, But…

 Is Evergrande China’s Lehman? No, it isn’t. But it may very well be its Countrywide Financial.  

Countrywide rose spectacularly on the back of the US real estate bubble by writing an enormous amount of home mortgages that were packaged by Wall Street into all kinds of MBS (mortgage backed securities). At the top of the bubble, lenders couldn’t care less about the creditworthiness of the borrowers. 

Countrywide’s collapse was one of the first signs that the Credit Bubble had burst. Its stock started plunging in mid 2007 and the company was bought out by Bank of America in January 2008 (BOA has regretted it ever since). 

Lehman, on the other hand, filed for bankruptcy much later, in September 2008.

Evergrande is one of China’s largest real estate developers, concentrating on building and financing huge residential properties. It finances its projects through… did you guess it?… bond-type investment products sold to retail and institutional investors. So, no, Evergrande is not Lehman. But it looks awfully similar to Countrywide.


Wednesday, September 22, 2021

Sudden Debt Limit

 The US debt limit now stands at almost $29 trillion and has already been exceeded by a tad, with the Treasury employing emergency-type funding techniques to keep paying its bills (mostly wages). 

Congress needs to vote an increase on the limit, but Democrats want a moratorium on the limit until the end of 2022 (ie no debt limit until then), while Republicans want no increase whatsoever. In other words, they are polar opposites.

Looking at the chart below I can’t really blame the Republicans…. On the other hand, I see the need for immediate investment in infrastructure, particularly in the sustainable energy sector. 


How about this radical idea: BALANCE THE BUDGET! It’s not rocket science, just make sure taxes are raised back to a sustainable level. Trump pushed corporate and individual tax rates to record lows, so there is plenty of room to raise revenue.

Here’s a compromise: a small debt limit increase to tide things over now combined with an immediate significant tax increase on corporate, individual and capital gains income at the high brackets, plus a modest annual tax on large wealth.

It is high time for the US to understand it can’t print its way out of trouble ad infinitum..  


Tuesday, September 21, 2021

The Demise Of Casino Capitalism

Banking, finance and markets exist to make the economy run smoothly. From money transfers and currency exchange, to raising capital for new or existing companies, their role is supportive and secondary. Finance is like a dog’s tail: basically useless except for maintaining balance. And, like I’ve said many times before, in the US the tail is now wagging the dog.

Finance, insurance and real estate (the FIRE tail) accounts for an enormous 22.3% of America’s total GDP, nearly double professional services, the second largest sector.  If we add Government, another sector that acts as an economic facilitator as opposed to being a primary producer, the total rises to an astonishing 35% of GDP. (Keep this in mind, I’ll revert to it at the end).

By stark contrast, Manufacturing which was once America’s proud creator of the currently evaporating middle class, has shrunk to fourth place at a mere 10.8%..


Looking at financial businesses alone, their share of GDP has quadrupled to nearly 9%.

The “financialization” of the economy may produce enormous and quick rewards for those select few who can take advantage of it, but it does absolutely nothing for all the rest. I mean, hedge fund managers are making $1+ billion per year, but employees at the companies whose stocks he/she is trading often need food stamps to survive (keep this in mind, too).

Like all bubbles, the finance economy has gone to extremes. While you may dismiss some crazy instances like GameStop, DogeCoin and “art” NFTs as one of a kind aberrations, you can’t ignore what is happening to the overall stock market.  Its total capitalization now stands at an all time high 200% of GDP, well above the 140% reached during the dotcom mania (1999-2000) and double the level of 2007, right before the Debt Bubble burst.

Is this casino capitalism economy sustainable? Of course not, the tail can’t keep wagging the US dog, particularly when there are other much less waggy dogs out there nipping at its heels (eg China, as Biden himself put it, “is having our lunch”).
=============
Final thoughts: the US won the Cold War when the USSR collapsed, seemingly within days. At the end, USSR was spending almost 20% of its GDP on defense while its middle class had to scrounge to find even basic necessities. It’s not a perfect parallel to the US today, of course, but it sort of rhymes, just substitute finance for defense.

There is one major difference: unlike the USSR, in the US the average Joe can dream of hitting it big by hard work, guts and brains, even if his/her chances of success are actually minimal. Americans, however, have (finally?) come to realize that the American Dream is now pie-in-the-sky, a situation creating huge dissent and class division. Never before  have mainstream American politics been so decisively shaped by polar opposites like Trump and Sanders. 

Here’s a question: could America’s version of Casino Capitalism collapse almost overnight (in a historical time scale)? 

Monday, September 20, 2021

The Mother Of All Bubbles - Are We In For An Unprecedented Crash? (Part V)

 ….continued from previous posts…

Part V - Thought Is Faster Than Light

On Part II of the series I laid out six concerns that could produce an unprecedented crash. Number two:

Speed: computers have made everything faster. Communications, transactions, manufacturing, transportation, logistics, decision making. Reaction to anything is nearly instantaneous.

I would like to expand on this a bit more, though from a non-technological perspective. 

While algorithmic and high frequency (flash) trading are still very prevalent in today’s markets, I’m not looking at them today. Instead, I want to focus on the one thing that seemingly travels faster than light: thought, including the subcategories of memory and feelings. (Yeah, ok, the brain, too, works via electrical impulses, but you get my point).

In my opinion, most everyone active in markets today, amateur or pro, individual or institution, knows (ie thinks, feels) that the US stock market is currently driven by momentum alone, completely detached from all fundamentals such as price to book, price to earnings, dividend yield, etc. The basic reason everyone mentions when asked “why buy or own stocks right now?” is: “because they are going up.”  

You don’t have to go far for proof, just look at the wildly popular SPACs. People are willing to subject themselves to an immediate loss of their capital (due to SPACs origination fees, commissions and expenses) to invest in nothing  tangible, just a promise that whenever the SPAC merges with whatever, the result will be something that will go certainly up. Speculation on momentum, and nothing else. 

Since everyone knows this, that the market is hanging on momentum alone, how quickly will everyone jump ship once momentum shifts? How quickly will the thought of exuberance transform to panic?  Remember, retail speculators today don’t even have to call a broker to place a sell order (he/she may change a speculator’s mind), it’s all a button on an app on a phone. There are no brakes in the system.

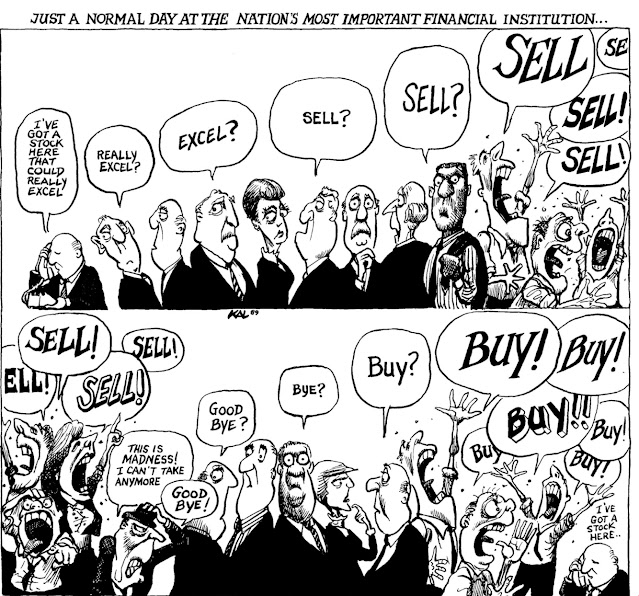
Today, market information is disseminated instantly to all, and the thoughts/feelings it produces, ranging from greed to panic are also transformed into action instantly. The classic KAL cartoon below sadly belongs to another era…there’s too much of a delay.


All right, maybe an old cartoon isn’t exactly convincing to you. How about what happened today to a Chinese property developer’s stock trading in the Hong Kong exchange, down 95% in one day - see chart below. Fast enough transmission of fear for you? (On the heels of Evergrande… sounds like Souza’s USMC march, doesn’t it?)


Saturday, September 18, 2021

The Mother Of All Bubbles - Are We In For An Unprecedented Crash? (Part IV)

….continued from previous posts…

Part IV - It’s Only Money

Some years ago a gentleman I worked with at an investment bank had a saying: “It’s only money”. John K. was at least 20 years my senior, having started his career in the early 1960s. At the time, I thought he was merely being sentimental, as in “money can’t buy you love”.  It took me a while to realize that John was being literal and was referring to markets.

Market prices are marginal, ie they are determined by incremental, instead of total, supply/demand and, since they float on a sea of money they rise and fall along with its ebb and flow. John was right: it’s only money. Emphasis on only.


It’s even more so with stocks, since unlike, say, wheat, they have no tangible underlying physical demand and are therefore priced at multiples of other markers like earnings, sales, assets, etc. You can’t eat stocks or, these days, use them as wallpaper; furthermore, their prices are derived from a consensus view of the future, since just about everyone ignores the past. 


Therefore, tongue in cheek, how are stocks any different from Papal indulgences? After all, you pay a given price for a stock today because you believe it to be a fair representation of the future. We call it a discount mechanism, but it is merely one more article of faith in the Permagrowth religion. The more you believe, the more you pay. 


But, wait a minute… what about “it’s only money”? Show me the money, cries the unbeliever - so voila: the connection between money/more money/much more money and share prices is obvious, as you can see in the charts of M3 and S&P 500.


Lest we forget, I’ll end today’s post with a reminder: money is debt. More money is more debt. Much more money is much more debt. 

Why the reminder? Two reasons:
  1. Some will argue that more money/debt is a natural consequence of higher GDP and therefore there is nothing to worry about. False: Debt/GDP is now the highest in US history. Today it takes four times more debt dollars to produce a dollar of GDP than it did in 1980. Debt to GDP has soared from 30% to 125%.
  2. Bubbles initially thrive on debt (leverage) but are eventually poisoned by an overdose of it.The bigger the leverage, the bigger the crash once the bubble is popped. Unprecedented debt therefore will, by default (pun intended), result in an unprecedented crash.
And there you have it…. I may write one more post in this series to include the other elements mentioned in the second post, not sure yet.


Friday, September 17, 2021

The Mother Of All Bubbles - Are We In For An Unprecedented Crash? (Part III)

 …. continued from previous posts…

Part III - Permagrowth As A Runaway Reaction

Continuing from yesterday’s post, let’s put together all six points and apply them to our dominant Permagrowth socioeconomic model. (If you haven’t read my posts before, Permagrowth is my term for the incessant expansion of everything, from population and consumption to money supply and debt.)

Permagrowth is much more than an economic model. Above all, it is a way of life where “more is better” has become rigid and unquestionable dogma. It comes closer to the unshakeable faith in Heaven and Hell dominant in 16th Century Catholic Europe than, say, the economic theories developed by Adam Smith, Keynes, Friedman, or even Marx. In other words, Permagrowth is now a religion. If you don’t believe me, ask anyone why they buy the latest iPhone.

The Pope sold indulgences so that sinners could get into Heaven by paying a steep price in cash. Likewise, Permagrowth devotees are fundamentally convinced that everyone will be “saved” with more money, higher prices for assets, more wealth on paper. Our sins of raping the environment, depleting precious habitats and unleashing natural disasters (eg COVID) are all washed away by … higher stock or real estate prices.

Then came Martin Luther’s Ninety-Five Theses and within just one day in Wittenberg the world changed.


Only Faith In God Decides Who Is Saved, Not Money 

(Only You Can Change The World, Money Can’t 😜)

Change can occur with lightning speed when conditions are right. But it comes as a shock to those lulled into apathy by what they perceive as “normality” in the period immediately preceding change. It was “normal” for the Catholic Church to sell indulgences since the Pope ex cathedra was infallible and God’s sole representative on Earth. It was “normal” for the USSR to produce thousands of nuclear warheads but not enough toilet paper. Dogma and apathy trump common sense every time - until they don’t.

How “normal” is Permagrowth today? My thesis is that it is utterly untenable, that constant expansion has become a runaway reaction that can no longer be contained in its reactor vessel. Think Union Carbide and Bhopal, India writ on a global scale. Its deleterious products are spilling over: not only climate change and habitat destruction, but socioeconomic and geopolitical dislocations are just as rampant. And it’s happening fast - very, very fast.

I could give dozens of examples, but if you’ve been reading this blog you can easily identify them. The most ardent acolyte of the Permagrowth religion is the stock market, particularly in the anything-goes US. 

I’ll be focusing on that in the next post.

…. to be continued…


Thursday, September 16, 2021

The Mother Of All Bubbles - Are We In For An Unprecedented Crash? (Part II)

 …continued from Part I. 

Hopefully I didn’t bore you with ancient history and you are now reading …

Part II - The Big Six 

The basic idea behind this series of posts is that I have never before experienced such extreme conditions in the economy, geopolitics and markets in 40 years as a finance professional. Same holds going back further in history.

In my opinion, these are the most worrisome underlying fundamentals today:

  1. Scale: everything is larger and bigger. Global population, GDP per person, debt, consumption, pollution.
  2. Speed: computers have made everything faster. Communications, transactions, manufacturing, transportation, logistics, decision making. Reaction to anything is nearly instantaneous.
  3. Climate change and habitat destruction: we are destroying our human habitat at an unprecedented scale and speed.
  4. Risk appetite is at an all time high: Stocks in the US and EU are trading at heroic multiples and interest rates are zero or negative. Even recent bankrupts (eg Greece) and companies with junk ratings are borrowing at near zero interest. Central banks’ gusher of money is completely obscuring the dangers.
  5. Generation gap: young people who grew up with game and chat apps view markets as just another game. Their heavy participation in daily “meme” trading is very apparent and defies all common sense ideas on investing.
  6. End of Empire: the US was the undisputed global Empire for the past 100 years. This is no longer the case, as a resurgent China is now more determined and ready than ever to claim primacy, whilst America is riven with internal political, social and economic divisions. The previous switch of Empires created WWI and WWII - and it didn’t even involve a direct confrontation between the old Empire (British) and the new (USA). It was just Germany and Japan who thought they could squeeze into at least some of the vacuum left by Great Britain. Today, the confrontation is direct: China vs USA.
….. to be continued

Wednesday, September 15, 2021

The Mother Of All Bubbles - Are We In For An Unprecedented Crash? (Part I)

Today’s title may be unashamedly clickbait, but it is truly my gut feeling. Allow me to explain by first going back 40 years. This will be a series of consecutive posts.

Part I - Introduction

In the Fall of 1982 I was working at my first job as a chemical engineer for a very large international  firm that designed and built all manner of facilities, from detergent factories in Iraq (!)  and oil refineries in Delaware, to a huge synthetic fuels plant in Beulah, North Dakota. Sounds exciting, but it was actually pretty boring stuff, since as a junior engineer I was assigned only the most basic scut work. Think glorified plumber with a Masters degree and a calculator.

But, the company had a terrific in-house lunch cafeteria where prices were heavily subsidized.  Smart, since it discouraged employees from going out on long lunches. You could finish lunch in 15 minutes and still have plenty of time to chat with coworkers or read the paper, before going back to work.

One day after lunch, I saw an article in the NY Times about a calculation for the “inflation-adjusted Dow Jones Industrial Average” and how it came out much higher than where it was then trading. My rational, mathematical mind was intrigued and soon hooked. I bought a couple of beginner’s books on stocks and subscribed to the Value Line, at the time a very popular weekly stock-picking and analysis service.  I opened a brokerage account, invested some cash … and 18 months later I had job offers from both Merrill and Dean Witter. I chose the first - and a lot of water has since passed under the bridge, no need to detail it here. 


From Synthetic Fuels To Synthetic Swaps

Suffice to say I lived through the 1980s boom and the 1987 Crash (it’s a forgotten blip now, but people were  literally jumping out of windows), the slow recovery, then the dotcom nonsense and bust, the long recovery, then the Great Debt Bubble and bust with the PIIGS snafu, the incredible (at the time) QE, the loooooooong recovery, including the colorful (so to speak) President Trump. Throw in the likes of Paul Volcker, Alan Greenspan and Ben Bernanke. (I won’t mention the current Chairman, he ain’t worth the pixels.)

So, I’ve been around the block. Several times, and always in the “sharp” edge of financial markets where if you stumble, you bleed. Meaning, I’m not an analyst 😜. Moreover, I’ve read a lot of financial and market history. A lot. I can honestly claim that there aren’t many market bubbles and crises that I’m not familiar with, one way or another..

And now, we have this…  in my considered opinion.. The Mother Of All Bubbles.

That’s the end of the Introduction. Sorry if it seems like I’m patting myself in the back but I first have to establish my creds. 

To be continued… 


Tuesday, September 14, 2021

Taxes, Deficits, Debt And Markets

 Effective corporate tax rates in the US are now at 14%, the lowest level in history. Compare this with a high of 45% during the Reagan presidency. Yes,  the iconic Republican President taxed corporations three times more heavily than Democrat Biden does now.


Conversely, federal debt as a percentage of GDP is at 125%, very near the highest level in history. Compare this with a low of 30-50%, again during Reagan’s presidency. If you were around back then (I was) you remember the huge ado about “soaring Federal debt”. Seems silly now, eh?


Debt is created by persistent budget deficits. In 2020 federal deficit reached 15% of GDP, the highest since WWII. Yes, the pandemic certainly worsened the deficit, but it wasn’t so much better before. The US has been running serious deficits since 1975, except for a few years during Clinton. Notice the impact of the Debt Crisis in 2007-10, when the government spent hundreds of billions to save banks, mortgage lenders and insurance companies.


Every sane American should now be demanding higher taxes. Democrats in Congress are trying to put together a rather insipid increase, but even this may be watered down. All Republicans are against it and probably a couple of Democrats, too. Something will pass for sure, but probably nothing big enough to make a difference. Despite AOC and Bernie Sanders…


AOC At The Met Gala

So far, markets are betting that nothing will change materially. Hmmm… the Devil being in the details, I think what is more interesting to follow are proposals for higher wealth and capital gains taxes. Especially for the top 1-5% of Americans who not only own an astonishing share of national wealth (two, yes just two, Americans own more wealth than the bottom 140 million Americans combined), they are also the biggest tax cheats. Wealth and gains taxes may pass more easily, too, since they play well with voters (“soak the rich”). And - this time - the voters are right, too.

To paraphrase Churchill: Never before have so few benefited so much from the indebtedness and consumption of so many.


Climate Crisis: We Need A Permarecession

The Permagrowth Economy is going to wipe out humanity from Earth.

 More specifically, our insatiable desire for ever more cheap goods, meat and travel for every man woman and child, especially the billions of Asians that until recently lived on “a bowl of rice”, is going to create one more Extinction Event - and this time it’s not going to be a comet falling from the sky.

While it’s easy to blame China for a big part in the jump of GHG emissions, please keep in mind that the West is now importing most of its consumer goods from China, ie it has shifted a large portion of its own emissions to Asia. Add the CO2 produced by shipping and real Western emissions are larger than they seem.

What can we do? Reduce consumption of EVERYTHING, from cheap T-shirts and meat, to airplane travel. There is really no other way, because recycling and renewable energy are mere aspirins - if that. 

The COVID pandemic was (is?) a tremendous opportunity for the world to slow down and step back, to create a different socioeconomic model based on Sustainability. Unfortunately, governments panicked and instead of tapping the brakes they stepped hard on the accelerator by printing trillions in new money.

I’m afraid that the only possible solution now is a hard Crash followed by a Permarecession. Actually, we already have the model: Japan during the last 30+ years.


Monday, September 13, 2021

Money Destruction

 “Can money be destroyed?” This was the question I was asked many years ago by George P., a brilliant young man who two years later became the youngest ever Managing Director at one of the largest and most prestigious US investment banks. I was taken aback by his question, because although it appeared simple, it was not.

We quickly established that he did not mean “value”, eg the price of a stock or any other asset going down in price, or the self-evident physical destruction of paper currency. He was after something else, something much more fundamental. I was stumped, so he just said “never mind” and we left it at that. I was busy with day to day work, so I didn’t revisit his question until much later.

Segue to yesterday post’s opening statement: “Money is debt and debt is money”, and the answer to George’s question becomes obvious: the ONLY way to destroy money is to destroy debt, ie to fail to repay the principal amount of a loan or bond. In other words, to go bankrupt and/or write off all or some of the debt. Money expansion being the primary raw material of “growth”, its destruction leads to a contraction, anathema in our Permagrowth society.

Which is precisely why the Treasury/Fed stepped in during the Great Debt Crisis of 2007-09 with unprecedented QE to replace the money being destroyed by massive defaults, particularly in the real estate sector. As new money piled in, “growth” naturally resumed.

And segue to today… the pandemic, a very real natural phenomenon (as opposed to, say, artificial debt crises and market bubbles) is being “treated” in great part by printing even more money. More than ever before. But, the global “real” economy cannot possibly utilize all this money as fast as it is created. It cannot mine iron ore, it cannot produce steel, cars, widgets, anywhere near as fast as the expansion of money. So, duh!!, instead of real growth we get price inflation. 

In the 18 months from January 2020 to June 2021 the net change in US GDP is $1.04 trillion, but the increase in M2 is a whopping $5.74 trillion, see below. Money supply rose more than 5 times faster than nominal GDP!


Lots and lots of money combined with a constriction of growth… guess what you get? Stagflation. Add a touch of climate change obstacles (eg soaring pollution permit prices) and stagflation gets more entrenched. Until, that is, money (debt) starts to get destroyed (without replacement) and money supply goes down. IF this is allowed to happen, that is. And, right now, it is certainly not allowed - at least in the US and EU, which continue to print with abandon. 


Sunday, September 12, 2021

The GDP Factory And M2 As Raw Material

Money is debt and debt is money. It wasn’t always thus, but it certainly has been since the US went off the gold standard back in FDR’s time (June 5, 1933).   If you have any doubt, just look at the charts tracking debt and M2 money stock as a percentage of GDP.

The recent vertical rise in both is due to the Fed’s incessant printing (aka QE on steroids), but the trouble started earlier, when the Fed first began its QE operations to prevent a total collapse during the Great Debt Crisis of 2007-10.


M2 is now at 90% of US GDP, ie there is almost one dollar floating out there for each dollar of economic activity. That’s up from 50 cents per dollar of GDP in 2008, ie before the Fed started its QE. 

Should we be worried? I’m not sure, but I really don’t like this “monetization” of the US economy. It somehow rings hollow to need all this “cash” sloshing around in order to produce a unit of GDP. It is, in my opinion, a very fundamental measure of structural inflation.  Or, at least, of potential hyperinflation.

Think of the economy as a factory producing GDP dollars, using M2 dollars as an input. Well, today’s factory is using a lot more $M2s to produce $GDPs than in the past. Ditto for debt. 

Can this be good? No, it can’t be. Sooner or later this money will find its way to the “real” economy where producers of goods and services will realize that dollars are worth less than before and thus demand  to receive more for their products. As Milton Friedman said, inflation is always and everywhere a monetary issue.

 You don’t believe it? Even in Rome around 260 AD inflation soared to 1000% since the gold content of the coinage was dropped to 5%.  It had previously dropped from 100% to 90%, then 60%…. 


Saturday, September 11, 2021

Shipping Rates Deja Vu

 The cost of shipping a 40-foot container from Shanghai to Los Angeles has risen eightfold since late 2019 to almost $12.000.  Other routes have seen similar increases, see below.


What does this mean to you and me? It depends.

A 40ft, 66 cubic meter container (double the.size of the “standard” 20ft box) can fit some 800-1000 large flat screen TVs. Do the math: container shipping now costs around $12-15 per TV, up from $1.5-1.90. It’s a huge increase, but for such relatively compact and high value items it’s not exactly a disaster. The higher shipping costs may be absorbed with relatively minor price hikes. For even higher value and smaller items (eg iPhones) the impact to the final consumer is near negligible.

However, for an importer of cheap, large plush teddy bears things are dire. Same holds for all imported goods that have the killer combination of large size and low unit price. For example, clothing/shoes, furniture, toys, even coffee and fruit are shipped in containers. There, prices will need to be adjusted very significantly. Big box stores and their customers will definitely be in trouble.

Two days ago, a ship-owning company announced it chartered one of its Panamax containerships for 2-3 months at an all time high of $200.000 per day. That’s $12-18 million in revenue. Less than three years ago such vessels were in such low demand that many ended in the scrapyard, essentially worthless. Kinda like a meme stock with a super duper propeller.

Long time readers of this blog may remember my posts in 2007 about insane dry bulk cargo rates, and one shipping company’s stock trading at nosebleed levels. It was a time when, incredibly, oil tankers were being retrofitted as dry bulk carriers. Anyone with any type of shipping experience realized what a panic-driven move that was, at the time.  Well, shipping rates collapsed soon thereafter and the stock became utterly worthless.

Guess what is happening now? Bulk carriers are being retrofitted as containerships… ayup…it’s deja vu all over again 😜

Things have gotten so bad that the world’s third largest container shipping company just announced that it is freezing spot shipping rates until February 1, 2022 - a dubious move, of course. It’s like OPEC freezing oil prices at $120 per barrel. Still, something to think about in this crazy all-bubble time.

Why are containership rates so high? For one, demand for cheap imports came zooming back after long lockdowns. Secondly, ports had to delay unloadings because of workers getting sick/isolating. Ships that would normally turn around in a day or two are now idling outside ports for more than a week, thus reducing available shipping supply.  It won’t last much longer, but for now it is fueling consumer inflation substantially.


Friday, September 10, 2021

Is America A Third World Country, Or Is It Just A Bubble?

 Here’s an Instagram post by Bernie Sanders. So, being that such wealth and income disparity is a major characteristic of Third World countries, is the US one of them?

Or, is it that a stock market bubble has ballooned the wealth of those two Americans so much (and the 1%’s)?