Thursday, December 24, 2020

The Most Worrisome Chart In My Career

 In a career spanning almost 40 years, I have never observed a more worrisome chart pattern as the one below.  If you are at all scientifically minded, this pattern of higher highs and lower lows looks like an out of control system that is about to fall apart, something like a runaway train that is swaying hard back and forth just before it jumps its tracks and crashes.

Adding to my worry is the behavior of the Relative Strength Index, which keeps diverging negatively, ie it keeps going lower despite new highs on the S&P itself.

I hope that things cool down, but I’m not optimistic. After all, the Grinch did steal Christmas !


Sunday, August 9, 2020

Train Wreck Warning

  1.  Fitch just reduced the outlook for US debt to Negative from Stable.  This is the first step to a possible downgrade.
  2. The US dollar is weakening fast.
  3. The budget deficit widened to $865 billion for the month of June alone.  For the 2020 fiscal year it is expected to reach $3.7 trillion or 20% of GDP.
  4. Mr. Trump just signed executive orders extending extra unemployment benefits AND suspended payroll tax collections which fund Social Security and Medicare.


Sound fiscal policy, a top credit rating and a strong currency are the hallmarks of Empire. Lose them and the Empire crumbles.  Just ask the Romans or, more recently, the Brits.

Thursday, July 30, 2020

The Bipolar States

Two pictures. Two diametrically opposed realities.

Yup, it’s official folks... the US is bipolar - someone pass the lithium....


Tuesday, July 28, 2020

Signs Of The Times

Short post today... markets continue in LaLaLand mode despite ever increasing COVID cases, choosing to focus instead on the eventual future economic rebound to be fueled by the trillions of added Fed money. Crucial to this expectation is that COVID will soon, very soon, subside.  But, it isn’t, and there are signs of that out there.

Flash back to February.  Despite few cases reported outside of China, the release of the new James Bond movie was moved from April to November.  You bet it wasn’t by accident or “excessive” caution.  When it comes to hundreds of millions in revenue, people make sure they know the facts.

Yesterday, Google announced that it will have ALL its employees work from home until  at least  July 2021.  You think they know something?  You bet they do.

As for 007... Despite the old movie, You Only Live Once, so be cautious and wear your masks my friends - be safe.


Wednesday, July 15, 2020

US Economy: The No-Fly Zone

If the US economy is bouncing back strongly, how come air travel is not?  The chart is from data by the TSA, and shows passenger traffic down 75% from 2019 levels.

IMHO, the “bounce” is mostly wishful thinking stoked by an absurd stock market bubble feeding on the self same wishful thinking in circular fashion.

Two similes:  The Emperor’s New Clothes (the market is strutting around naked) and The Chicken Game (whoever blinks first could possibly survive).  Both lead to the conclusion that if and when the mood changes - and it could change in a flash - the move down could be a crash unlike any in the history of US markets.


Monday, July 13, 2020

The Debt And COVID Crises - A Markets Retrospective

Today’s subject is the similarity between the Debt Crisis and the COVID Crisis.

Seemingly, there is none -  but if you go back to my old posts from 2006-07 you will observe this:  the debt, asset and derivatives bubble was obvious for all to see well before it burst, yet markets kept on rising, acting as if everything was hunky-dory.  It took almost a year and a half of la-di-dah until the bottom fell out in mid 2008 (Chart 1).

Chart 1

Here’s patting myself on the back: on my Decnember 31, 2006 post, I had predicted a “rational” level for S&P 500 in the range of 580-700.  On that day the index had reached a high of 1575. It bottomed out in early March 2009 at 660 for a whopping 58% drop, but who’s counting, eh?

Well.... I am!  More  specifically,  on my 2006 New Year’s Eve post I wrote:  “...this implies an ultimate drop of 59% from current levels for US stocks.”  Ok, I’ll give myself a double pat on the back!  I was wrong on one thing, though.  I thought that such a big drop would take five, or even ten, years.  It ended up happening - top to bottom - in just two.

Credentials established, let’s move on to the present (beware, as usual, that past performance is no guarantee of future success),

First, three general  observations:
  1. The stock market has become unusually volatile in the last five years.  Moves, up or down, happen extremely fast - in a matter of days, if not hours.  This has a lot do with a) flash/algo trading and b) the prevalence of tracker ETFs which are forced to buy/sell in robot fashion.  Markets move fast nowadays.
  2. Interest rates are zero or negative across the largest part of the global economy: USA, EU, Japan.  Central banks have no more conventional weapons left with which to fight recessions and are now just printing money.  There is even a newfangled, pseudoscientific term for it: Modern Monetary Theory.  
  3. COVID is a Real Economy crisis: it destroys jobs and incomes, leading to a much lower marginal propensity to spend, particularly on unnecessary goods and services.  This is a once in a lifetime, in-your-face lethal pandemic, not some dotcom or subprime loan bubble.  You can easily ignore a bunch of foreclosures happening two towns away, but record viral infections are huge alarm bells.  So what?  You SAVE your cash, that’s what...
Ok, then.  After a fast and furious decline, markets are now discounting a V-shaped fast and furious economic rebound.  There are zero signs of it happening thus far, but the stock market has discounted it, and more, particularly in the tech sector.

US market capitalization is at 148% of GDP, just about the highest level in history - and this is based on 2019 GDP.  Factor in that 2020 GDP will be at least 6% lower and the ratio goes to 157% (Charts 2, 3).


Charts 2, 3

Back in 12/31/2006 my prediction for a massive market drop was based on DPI (Disposable Personal Income) and debt service, appropriate metrics for a Debt Bubble.  Today, I will base my prediction on GDP, since this is an economic crisis.

Bottom line, then: IMHO, look for Market Cap / GDP to revert to a range of 75% - 100%.  As of today, this would mean a range of 1.600 - 2.130 for SP500 vs. 3.200.  And that’s without accounting for the possibility for even lower GDP.

Notice how for 30 years between 1970-2000 total cap was below GDP and afterwards rose above it only during the dotcom and Debt Bubbles.  But since 2016 it has gone wild, mostly because President Trump slashed corporate tax rates to the lowest level in nearly a century.

Here’s a question: given the current, unprecedented budget deficit for FY 2020 (another is probable for 2021, too) what is the next President going to do to repair the damage?  And what will higher corporate taxes do to share valuations?


Tuesday, July 7, 2020

There’s Only One Buyer -The Fed

Sooner or later (my bet is sooner) investors and speculators will realize that the Fed is currently the only major buyer for US stocks and bonds - at least indirectly, if not directly since the US central bank is prohibited from buying shares (other central banks aren’t, e.g. the Swiss National Bank has a portfolio valued at over $95 billion in stocks).

What do I mean by indirectly? Simple: the Fed has flooded the system with $3 trillion, ballooning its balance sheet from $4.2 to $7.2 trillion in mere weeks.  By comparison, it took 20 years for the Fed’s assets to rise from $1 trillion to $4 trillion (Chart 1). To be clear, that’s  fresh dollars circulating in the system.


Chart 1

(Note: There is a parallel observation to be made on Chart 1;  after dealing with the Credit Crisis in 2008-10 by doubling assets to $2 trillion, the Fed kept printing money and reached to $4.5 trillion.  It’s no wonder stock prices, bonds, real estate, etc. kept rising and rising.)

So, asset prices are being boosted by the Fed’s printing presses for a long time now.  The latest injection is, therefore, not unusual - it’s just spectacularly enormous.and furiously fast.  I think, dear reader, you understand why I say that the Fed is, essentially, the only buyer.

What would happen if the printing presses stopped, or if they started running in reverse? How long would it take for trigger-happy speculators to realize there’s no one else left to buy their overbloated portfolios?  To quote one of my (very) old posts, how long before people realize they own trading sardines rather than eating sardines? (RIP Sandra K. 😢).

It’s very early days to conclude that the Fed is reversing course, but the last few weeks have seen its balance sheet shrink, if only modestly (Chart 2).

More to follow as data become available on this, the Moral Hazard to end all moral hazards..


Chart 2


Monday, July 6, 2020

Smart Money Moves - Warren Buffett

Berkshire Energy announced a $9.7 billion deal to acquire the natural gas pipeline and storage facility business of Dominion.  It is being interpreted  as a vote of confidence for the economy by Warren Buffett.  Nothing could be further from the truth.

First of all, the deal involves $4 billion in cash and the assumption of $5.7 billion in debt.  That’s a tiny investment for Berkshire Hathaway which had accumulated $137 billion in cash at the end of 1Q20 (the deal “consumes” just 2.9% of the cash hoard).

Secondly, the gas pipeline business is a highly regulated utility that produces stable annual returns, a very good alternative to, say, government bonds.

So, if anything, this is a vote of NON confidence by Mr. Buffett.  It’s not as if he’s buying anything related to a V recovery, consumer spending, etc. represented by the “bargains” in the travel and leisure or retail sectors.

The sage is being as conservative as possible.

Friday, July 3, 2020

Employment Data - Not All Job Gains Are Created Equal

According to the Bureau of Labor Statistics (BLS) the US added a total of 7.5 million jobs in May and June, after suffering a massive wave of 32 million layoffs in March and April due to COVID (Chart 1).  Mr. Trump gave himself laurels and markets (the only thing that apparently matters in this Brave New World)  cheered loudly.


Chart 1

But let’s look beyond the headline numbers.

In March and April 2020 the economy lost 32 million jobs;  8.5 million of them where in the Leisure and Hospitality sector, accounting for 27% of all job losses.  This same sector added back 3.5 million jobs in May - June (Charts 2 and 3) accounting for an oversize 47% of all jobs gained.

=> Keep this in mind: Leisure and Hospitality was 27% of all jobs lost, but 47% of all jobs gained back.

Chart 2


Chart 3

Why is this important? Because those are part-time, very low paying jobs: On average, such employees work only 25.5 hours per week and make $17/hr. (Table 1).   In fact, Leisure and Hospitality employees work the fewest hours and get paid the least wages of ALL employees. By comparison, the national averages for all private employees are 34.4 hours/week and $28/hr.


Table 1

Let’s do a bit of math: in March - April the private sector lost 32 million jobs worth:

 23.5 million jobs x 9 weeks x 34.4 hrs x $28 = $204 billion in non L&H jobs
Plus
8.5 million jobs x 9 weeks x 25.5 hrs x $17 = $33 billion in L&H jobs
for a total of $237 billion.

In May-June the economy gained 7.5 million jobs worth:

4.0 million jobs x 9 weeks x 34.4 hrs x $28 = $35 billion in non L&H jobs
Plus
3.5 million jobs x 9 weeks x 25.5 hrs x $17 = $14 billion in L&H jobs
for a total of $49 billion.

That’s a very long way from repairing the damage done to the real economy, no matter what Mr. Trump or stock indexes say.

(Looking at it another way, each job lost was worth $7.400, but each job gained only $6.500 - the economy is adding back mostly low value-added, low-paying jobs.)


Wednesday, July 1, 2020

Consumer Spending Will Make Or Break The Economy

Personal consumption makes up the vast majority of GDP in the United States, currently around 68-69% (see Chart 1).

Chart 1

So, what people choose to do with their disposable income (i.e. after taxes and deductions) is crucial for the economy: they can spend it, or save it.  This behavioral pattern, called Marginal Propensity to Spend, can be easily deduced by the difference between Disposable Income and Personal Consumption Expenditure, in dollar terms (see Chart 2).

Chart 2

Right before the COVID crisis Americans as a whole spent on average almost 90% of their disposable income (caveat: lower income families routinely spend 100% or more of their income, i.e. they go into debt, while richer ones save and invest more).  The gap between disposable income and consumer spending was running around $2 trillion per year, or just about 10% of GDP, and jumped to almost $7 trillion, a historically unprecedented 35% of GDP (all the figures are annualized) as the Trump administration sent everyone those $1.200 checks which people on lockdown had nowhere to spend (again, not the poorer folks).

The gap has now narrowed to a still enormous approx.  $5 trillion since there are no more handout checks and the US is slowly emerging from the lockdown with consumption boosted by pent up demand.

In my opinion, this is the single most important indicator of the economy’s current condition.  I will be watching closely, but I think that the Marginal Propensity to Spend will remain muted for quite some time and cause the economy to drag, instead of bounce.

Tuesday, June 30, 2020

Proximity Blindness

Seven States that are currently experiencing the sharpest rises in new daily COVID cases account for  35.5% of total US GDP:  CA, TX, FL, GA, AZ, LA and SC. Of those, just the first three produce a massive 28.5%.


By comparison,  three of the states which have managed to successfully deal with COVID (so far) are NY, NJ,  CT and produce a combined total of just 13% of GDP.

Yet, that’s where the vast majority of investment bankers, traders, hedge fund managers and  speculators live and work.  IMHO, they cannot but fall prey to a very human proximity blindness, particularly after suffering greatly from the virus.

May partly explain the phenomenal rebound rally.

Monday, June 29, 2020

Reading The Tea Leaves

Charting is an arcane art form 👽 at best and total mumbo  jumbo 👹 at worst.  Yet, it has its uses.  With no further ado, a long term chart of S&P 500 with some annotations.  I won’t add any comment, if you are a practitioner of the “dark arts” you will understand 😆


Friday, June 26, 2020

Something Is Gonna Give

One picture only: NASDAQ and daily new COVID cases in the US are both making new highs.

Something is seriously out of whack here...


Tuesday, June 23, 2020

The Five R’s - Deflation Warning

If nothing else, the coronavirus crisis has accelerated my conviction that our Permagrowth (tm) model is busted.  What’s Permagrowth?  Ever increasing consumer spending in the West on goods made cheaply in the East, all made possible by ever increasing debt. Some call it Globalization, but all it took was one microscopic virus to effectively kill it in a matter of days around the globe.

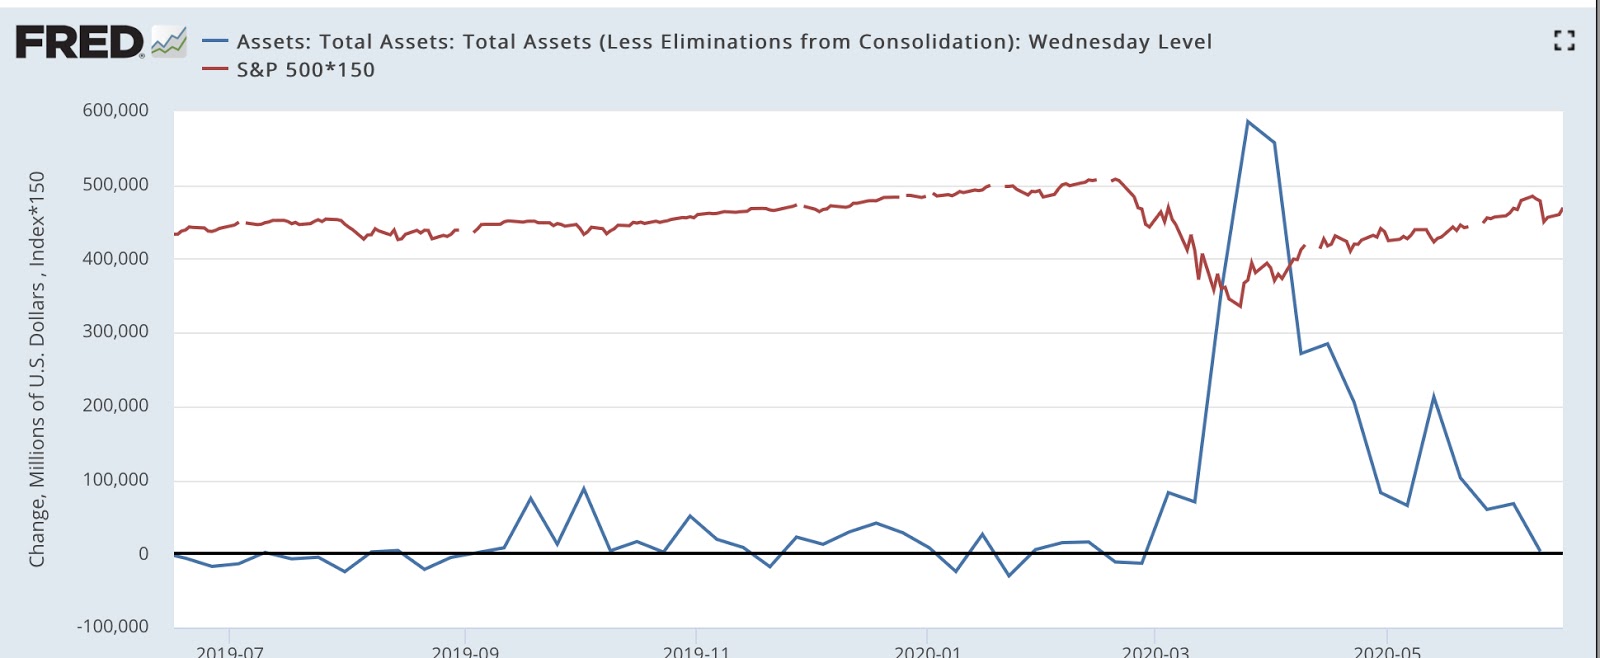
What is the cure currently used to revive it? More debt, of course, in the form of government bonds purchased (or financed) by central banks, almost exclusively.  The situation is so dire that the most extreme measures are being used.  For example, the ECB pays banks 0.5% to go out and buy government bonds that yield anywhere from 0% to 1.50%.  Yes, that’s right, the ECB lends at negative interest rates, confounding anyone who espouses “neither a lender nor a borrower be.”  In one transaction alone, the ECB is effectively both lender and borrower!! Double the sin, double the fun!!

Now, follow the trade: a bank can go to the ECB, borrow 10 billion euro and receive 50 million annually. It then turns around and buys 10 billion worth of, say, Greek government bonds and receives another 150 million, for a total of 200 million per year.  This is literally free money, produced entirely out of thin air.  No savings needed, no assets, no reserves.. nothing!

Obviously (to me alone??) this is a complete perversion of a proper financial system and a VERY loud alarm bell.  Wake up, folks:  “ Whatever it takes” are NOT soothing words, it’s a cry of desperation.

Anyway, back to the demise of Permagrowth.  I believe we are now seeing its last hurrah, soon to be replaced with something else.  What will that be?  Hopefully, the Five R’s practiced by 8 billion consumers in the following order:
  1. Reject - don’t buy the new “phone” (shoe, watch, app, trinket)
  2. Reduce - one “phone” is enough
  3. Repair - fix the “phone” when it’s damaged, instead of replacing it
  4. Reuse - give the old “phone” to your daughter
  5. Recycle - finally, recycle it


The Five R Economy

The US, EU, China and Japan have a combined GDP of $60 trillion, a whopping 75% of global GDP even though they account for only 30% of global population.  Consumption makes up almost 70% of GDP in the US, 60% in the EU and Japan -  and (just) 43% in China, which exports lots of what the other three consume, taking their IOUs as payment.

Now, when and if Permagrowth is replaced by the 5R’s the effects will be enormous - assuming, of course, that the change will be accomplished peacefully (not a foregone conclusion).  For one, deflation will be prevalent, resulting in sharply lower equity and corporate debt valuations.  Energy sources will not need to be as “dense” as today (oil, natural gas, coal) and could more easily shift to renewables.  The US dollar - petroleum relationship will come apart, leaving the dollar to fend for itself and the US government to seek a much more rational fiscal and monetary policy.

And that’s just for starters... it could get really nasty OR really spectacular out there.  Hopefully, we will all realize our full potential as human beings and choose the latter.

Monday, June 22, 2020

Elections

The Economist has come up with a US Presidential election prediction model which is updated daily. Right now it gives Mr. Biden an 87% chance of winning the electoral college votes.


In my opinion, this projection is completely ignored by the stock market which is focusing (hoping) on a rapid exit from COVID lockdowns, a possible vaccine, etc.  However, I believe that the fiscal policy of the next President is more important than anything else.

According to the Congressional Budget Office the budget deficit will reach $4 trillion this year, some 20% of GDP, or even higher if a second round of  business closures is necessary later on.  Combined with record low corporate tax rates, there is every reason to expect that a Democratic President will seek to repair finances by raising taxes on businesses, particularly those that benefited greatly during the COVID pandemic.

As things stand right now, the risk-reward balance for stocks, particularly the FANG++ types, is heavily skewed towards risk, IMHO. 

Friday, June 19, 2020

Jobless Claims

Initial and continued claims for unemployment benefits is, by far, the best concurrent indicator for the economy’s health.  Both are extremely high and seem to have stabilized at around 10 times higher than their previous levels (see charts below).


Initial Claims For Unemployment Benefits


Continued Claims For Unemployment Benefits

What does this mean?  That even after opening up after the lockdowns, businesses are still laying off a huge number of people and most of them are very weary of rehiring.  In other words, the economy is most certainly NOT currently in a V-shaped recovery.  For comparison, the highest level previously reached for continued claims was 6.8 million during the 2008-09 Debt Crisis, when the most that real GDP dropped was around 3.5%. If claims remain elevated, by this measure alone we’re looking for at least a 10% contraction going forward during 2020/21.

Now, the stock market has already bounced back in V fashion, apparently discounting a faster than ever economic rebound.  Or... is something else happening?  I will use just a single chart to illustrate: Shopify has zoomed almost 300% in just a few days during the pandemic.


Shopify Inc.

The company is currently capitalized at $101 billion, i.e. around 60x REVENUE.  Forget P/E, there are no Es, the company is losing money.

So, what gives?? My thesis is that a few million millennials got a few thousand dollars into their hands and decided to punt with it. What companies do they know and use, which “new ideas” and “new paradigms” do they think they understand better than everyone else, Warren Buffett included?  Why, everything Internet, of course... and wouldn’t you know it, similar chart patterns and nosebleed ratios can be seen across the entire “tech” sector, from Facebook and Amazon all the way to Spotify and Google.  Throw in a religious belief in the Fed as Saviour Of All and you get an enormous bubble..

But, what the millennials clearly do not understand is that the “real” economy is about earned income  (wages) and spending, and more specifically, disposable discretionary income - the part that remains after paying taxes and necessities such as mortgage/rent, food, transport, health, etc.  This is where the economy makes it or falls flat on its face - on the margin, not on the whole.

It does not take a genius to figure out that with a huge number of unemployed, earned income and the propensity to spend on non-essentials is sharply curtailed.  And, yes, it WILL affect the earnings of every company out there, Internet or not.

One more point, learned from decades of experience: in stocks, most money is lost by those who buy on the rebound and not on the initial sharp leg down.  That’s when the sharps unload by the bucket..

Wednesday, June 17, 2020

The Fed To The Market’s Rescue

“Never fight the Fed” is one of the oldest and probably most valid adages on Wall Street.  Apparently, it has just been proven true once again as $3 trillion were pumped into the economy in record time.


The Fed’s Balance Sheet Balloons to $7.2 Trillion

The short term correlation between added liquidity and share prices is 100%, as the next chart shows.  The Fed’s weekly injection of huge amounts of money coincided with S&P 500 bottoming out and then sharply rebounding.


Pump It Up 

Now, speculators and investors alike are firmly convinced that the Fed has “put a floor” under the market and will continue doing whatever it takes to keep the market going higher.  Notice, however, that new liquidity injections have now stopped completely.

Unlike what many may believe, the Fed’s stated objective is NOT to support stocks but to safeguard the smooth operation of the banking system and the economy as a whole.  Thus, if there is to be a correction in stock prices do not expect the Fed to intervene - unless it is so sharp and violent that it poses a threat to the system.

That “floor” under the stock market is not made out of stone...

Sunday, June 14, 2020

COVID19 Cases And The Economy

California, Texas and Florida have a combined population of 90 million, almost 30% of the US total. Unfortunately, but certainly not unexpectedly, COVID19 cases are once again rising there, after lockdowns were eased recently.

The dilemma is both simple and morally offensive: do we accept more people falling ill and dying for the sake of economic necessity, or do we re-impose severe social distancing measures?  To an extent, it’s not a 100% binary either/or question, since an economic depression eventually also has serious public health consequences.

Yet, for most people the immediate danger to health is more tangible and real than a statistical blip in mortality rates a couple years down the road.   That’s why I believe that when the current higher cases quickly translate into ICU admissions and, unavoidably, rising fatalities,  there will be great pressure on politicians to reinstitute lockdowns.

The result will be a deeper and more protracted recession, lasting longer than the bubbly financial markets is forecasting right now.


Thursday, June 11, 2020

Wealth Taxes On The Horizon

Not to pat myself on the back, but... ok I will 😆 As I wrote on my June 5 post, soaring costs for COVID19 will eventually lead to higher taxes.  In Britain the wheels are already in motion, according to Reuters, and they are pointed towards the wealthy.


Exclusive: Britain asks private bankers to discuss potential wealth taxes - source
https://reut.rs/30wXJ6r


Wednesday, June 10, 2020

Flight Data

The “real” economy is still very far from recovering, as witnessed by airline passenger data from TSA.  Daily traffic is off the absolute bottom reached in mid-April, but it is still 84% lower than last year.

Meanwhile, stocks have rebounded 100% as they discount a sharp and complete economic rebound in record time.  I remain a sceptic, and I have come up with a historical parallel for this disparity: the dotcom craze of 1999-2000.

Just like 20 years ago, stocks are rising vertically, discounting a future that is way out of touch with the present reality  In other words, it’s all “story” and no fundamentals.  The danger is that even a minor disappointment on how the said story evolves will produce a disproportionately negative effect on share prices.


Tuesday, June 9, 2020

Mind The FANGs

The stock market has rebounded in an astonishing fashion. But how?  In one acronym, FANG.

While other shares have mostly languished, shares of Facebook, Amazon, Netflix and Google have way outperformed and now make up 12% of the entire capitalization of S&P 500.  Yes, 0.8% of the companies move 12% of the index, a gearing  ratio of 15x. Remember, too, that S&P 500 is capitalization weighted, meaning that as FANG shares rise their impact on the index rises even more.

On the fundamentals, FANGs account for 4% of earnings and just 0.4% of sales.


For more on the subject, take a look at this report recently issued by Yardeni Research.


Saturday, June 6, 2020

Always Read The Fine Print

May’s employment report came as a shock: analysts expected a loss of 7-8 million jobs and we got a gain of 2.5 million, instead.  What gives?

The answer lies in the fine print at the very end of the BLS press release.

 Please read it and come to your own conclusion as to what is happening here...As Mark Twain famously said, “lies, damned lies, and statistics”.

All I’m going to say is this: as far as the numbers go unemployment went UP, and very significantly so, not down as the headlines proclaimed.


Read This And Weep - Or Laugh


Friday, June 5, 2020

Higher Taxes On the Horizon?

Federal debt has jumped a massive $3 trillion in just a few weeks and now stands at $26 trillion, or 137% of last year’s GDP, the highest on record.  Given that GDP will plunge a minimum of 6% this year, federal debt  will reach at least 146% of GDP by the end of 2020.

Sooner or later, someone will start worrying about the federal budget deficit, which closed 2019 at almost $1 trillion;  currently, the Congressional Budget Office expects it to reach $4 trillion in 2020, a massive 22.5% of this year's projected GDP.  That's WWII levels, but without the boost to the wartime economy which came from increased production and employment.  Indeed, the exact opposite is happening, as almost 40 million jobs have been lost and the economy is tanking (no pun intended).

So, let's ask the tough question: how will this massive budget deficit be reversed?  Sure, the economy will bounce back to a degree and boost tax revenue, but certainly not nearly enough.  Taxes will have to be raised, and pretty soon.

 Can they be raised?  Certainly - the corporate tax rate is the lowest it has been in 80 years and receipts the lowest in 20 years, even as the economy boomed after 2010.  Indeed, last year's corporate tax revenues were just one third (!!) of those in 2005.


Corporate Tax Rate Lowest Since 1940


Corporate Tax Receipts Lowest In 20 Years

Sure, it's too early to start raising taxes on anything when the country is trying to come out of the COVID19 crisis.  But it's certainly not too early to start thinking about it, and to start considering what such a tax hike will do to corporate earnings and stock valuations.

Stock valuations, you say?  Isn't NASDAQ making new all time highs?  Yes, it is... I really don't know what some people (and their flash algo trading machines) are smoking...


Tuesday, June 2, 2020

It’s The Jobs,

Take a look at where the jobs were lost in the US: most of them in the low-pay sectors of leisure, hospitality and retailing.  IMO this graph explains the anger, riots and looting taking place right now.

I think this is not a “common” anti-racism crisis and will not go away in just a few days, as it did in the past.  And this President is totally clueless...


The End Of Empire

This is what the downfall of Empire looks like.


Monday, June 1, 2020

Economic Suffocation

The US has one of the highest GINI coefficients amongst the OECD nations, ie income distribution is highly unequal, on a par with Turkey, Bulgaria, etc.  

GINI Coefficient In OECD Nations

The COVID19 crisis has thrown millions out of work - continued unemployment claims are at an unprecedented 21.5 million. Economic  insecurity rules the day.


Continued Claims For Unemployment Benefits

It is no wonder, then, that last week’s police violence incident has spilled over into rage, riots and looting.  I don’t think these are “mere” racial riots;  rather, they are angry responses to a simmering situation that is currently boiling over because of the lockdowns and their effect on the economy.

Saturday, May 30, 2020

Saving, Not Spending

To combat the COVID19 crisis the US government has gone very deeply into debt through the Federal Reserve, which has ballooned its balance sheet by an astonishing $3 trillion in just 45 days.

FRB Assets (Government Bonds) Soar

The money has gone to individuals as $1.200 checks and to various businesses as subsidies.  Consumer spending accounts for 70% of GDP, so the money was intended to sustain it and thus cushion the economy, even as unemployment soared. But, it didn’t.

Consumer spending collapsed by the most on record, as lots of people chose to play it safe and save it, instead. The strict lockdowns also played a role since most shops, restaurants, etc businesses were closed.

Consumer Spending Collapsed

Consequently, the saving rate jumped.

Saving Rate Jumps To 33%

Consumers will certainly resume spending as the lockdowns ease, but the crucial question is by how much and how fast?: In my opinion, not very much and rather slowly.  After all, unemployment is huge and so is the fear of a second viral wave in a few months.  People will play it safe, I think.


Thursday, May 28, 2020

Irrationally Early Hope

Some of us remember Alan Greenspan’s “irrational exuberance” quote in 1996, his way of signaling that the stockmarket’s dotcom craze was founded mostly on mass psychology rather than earnings expectations.  He was right, of course, but way, way, way too early, as NASDAQ peaked a long four years later and at stratospheric levels compared to 1996. As Keynes has purportedly said, markets can remain irrational (far) longer than you can remain liquid.


Irrational Exuberance

To draw a sort of a parallel with the present, share prices are rebounding after the plunge caused by the COVID19 pandemic, with investors betting that new vaccines and drugs will allow the global economy to resume growth very shortly.  Are they rational?  Yes, and no.

Yes, because human ingenuity (aka Science and Technology) works wonders when applied on a massive and coordinated scale.  Remember, we went from the Wright brothers flying a few yards over the Kitty Hawk sands to landing on the Moon in just 60 years.  Medicine is trickier, but I have no doubt that we will eventually find ways to combat COVID19.

No, because viral pandemics take time to die out, even with effective vaccines.  Not only does it take time to produce, distribute and administer them, it also takes lots of time for herd immunity to reach a high enough level, even after vaccination.  We need around 60-70% of the global population to develop effective immunity, either through vaccination or natural antibodies, in order for COVID19 to be dealt with.

Past modern era pandemics such as those of 1918, 1958 and 1968 took almost 3 years to burn out on their own.  Horizontal, massive national lockouts were not imposed back then, so the general population was rapidly infected, leading to millions of victims.  By the same token, herd immunity was also rapidly established and the virus waned.

Today, human lives are considered more precious, and public opinion is shaped more by social media than anything else, leading to a “save lives” vs. “save the economy” dilemma (false dilemma IMO). Thus, we can expect more restrictions to stay in place for longer and even strict lockdowns to be reimposed as the viral infection plays out.  The effects on economic activity are pretty obvious, and so are the risks for corporate profits, dividends and share buybacks.

So far, investors believe that central banks will save the global economy (and thus markets) by printing as much money as “it takes” until medical science comes to the rescue.  (They also seem to bet on vaccines being available in months rather than years.)  However, this is not a temporary liquidity or credit crisis, at least not for a big chunk of consumers and companies out there.  It is an earnings crisis.

Lockdowns have permanently and irretrievably erased earnings and cash flows for a slew of companies and their employees: the entire travel, hospitality, entertainment, gaming, sports, restaurant, leisure, education, the biggest chunk of retailing, oil and gas, transport, logistics and related services... the list is pretty huge, actually.  On the heels of massive layoffs and/or forced time off with minimum wages come mortgage, consumer and student loan delinquencies, hitting the banking sector hard, as well.

Bottom line: markets are hoping for, and discounting on the upside, a very, very rapid recovery from the COVID19 crisis.  IMHO, they are very, very early.


Wednesday, May 27, 2020

Damage Control, Is It Possible?

The economic damage done by the COVID19 pandemic is enormous.  Unemployment has soared, leading to a collapse in personal consumer expenditure (70% of GDP). Loan delinquencies are also climbing fast.

 Unemployment At Unprecedented Level

Consumer Spending Collapses

Can this damage be reversed quickly?  Some of it will be, as economies around the world come out of lockdowns and adjust to a “new normal” mode.  But, IMHO the level of economic activity will be significantly lower than before.  Consumers will reduce spending for non-essential goods and services (eg travel and leisure) and will add to savings, where possible.  After all, the virus is expected to make a comeback in the coming months.


 Personal Saving Rate Highest In 40 Years

Faced with this unprecedented economic collapse, can governments do anything beyond temporary, one-shot income subsidies?  Yes, of course:  they should create new jobs.  How?  Invest heavily in necessary infrastructure, a type of New Deal for the 21st Century.  We need a new energy system (renewable electric, possibly even nuclear) and sustainable, environmentally friendly plant-based food.

I don’t have any hopes of this happening under the present administration, however...

Friday, May 22, 2020

2008 Was Chickenfeed

Faced with a pandemic, i.e. a REAL crisis as opposed to a monetary/debt one, the entire world has chosen to combat it by throwing money at it!  It’s a bit like treating a broken leg by swaddling it in paper instead of plaster.

And, oh my, what a lot of paper!  The current explosion of the Fed’s balance sheet is making the 2008  operations look like chickenfeed, mere penny ante.

The Fed Balance Sheet Rockets To The Moon

The problem is real in a physical sense, not just perception: economic activity has seized up leading to massive unemployment or, in the case of the EU, massive state subsidies and layoff prohibitions to keep the quarantined workers off the official unemployment statistics.  It’s just smoke and mirrors.

So, we have a triple whammy here: significantly lower production lowers supply, somewhat steady demand  with the $1.200 checks etc. smoothing things out to a degree and a whole lot of new money sloshing around.  Put them together and... yeah, I think high inflation is a real threat, after the immediate health danger is over.

Inflation plus high unemployment?  Here’s  a dirty word from the late 1970s - early 80s:  Stagflation.

I’ll be returning to this theme in my next posts.