Tuesday, January 24, 2023

The Upcoming Debt Service Crunch For Households Will Impact Spending In A Big Way

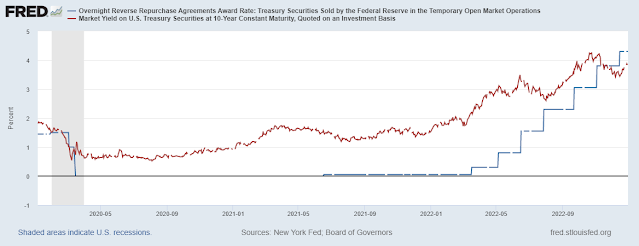
Consumer spending accounts for 68% of US GDP, so as the consumer goes so goes the economy.  In the last 10 years consumers saw their debt service payments go down very significantly as interest rates collapsed to near zero;  as a percent of disposable income household debt service in 2021 fell to near 8% from a high of 13% in 2008 (see chart below - blue line). 

This allowed consumers to boost spending on other items (eg streaming services) and, importantly, created a massive pool of money available to drive individual speculation in anything from meme stocks, cryptos and NFTs to index funds. 


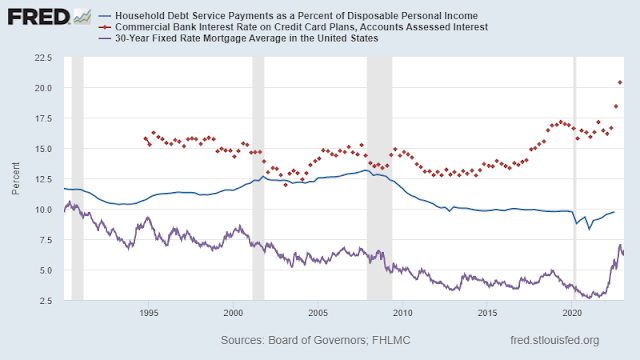
With interest rates now soaring this process is reversing.  Mortgage rates have jumped from 2.5% to 7% and credit cards from 16% to 21% (see chart above - purple line and red dots). Data on debt service lag by at least a quarter, so it cannot be seen on the chart, but it is certain it will jump to at least 11-12% of disposable income.  Notice how such levels were previously associated with recessions (grey areas on the chart).

Despite inflationary headwinds, overall consumer spending has remained relatively high, likely because employment is still very robust and wages are rising.  Also, household debt is still pretty low compared to 10-15 years ago, so adding debt may support spending.  But this can't last; the first signs of retrenchment are already visible, mostly at the loony edges of speculation.  Will this transit to other, conventional areas of consumer behavior?  I think so - big layoffs at Amazon, Meta, Spotify, etc. can only be explained in the light of lower household demand.  Likewise for Tesla's reduced prices.

Lower consumer spending = lower GDP = recession/zero growth.  After 4Q22, which may come in surprisingly higher than most think (Atlanta Fed GDPNow is projecting +3.5% vs market expectations of +1.5-2.5%), the consumer and the economy will have to deal with serious headwinds, debt service being a major issue.  Markets don't seem to take this into account and are back on their "risk-on" mode.  Even loony stuff is jumping - a pretty sure sign that speculators are back into action.  I believe they will be proven wrong.

Monday, January 23, 2023

Beware Of Japanese Black Swans: Minister Warns About Precarious Public Finances - And He's Right!

Japan's Finance Minister just warned of increasingly precarious finances. The combination of enormous debt, rising inflation and higher interest rates will severely impact public finances in a country already struggling with a rapidly aging population and near zero economic growth.

While zero growth at a time of climate change and habitat destruction is desirable in my opinion, it is  poison for debt service.

 Here's a series of charts.


Debt To GDP At 250+%


Stagnant GDP 


Persistent Budget Deficits Require Constant New Borrowing

Inflation Rises To 4%, A 40+ Year High

The Bank of Japan (BOJ) has been engaging in the most massive "Yield Curve Control" (YCC) policy in history.  YCC is a polite (obfuscatory?) way of saying that the central bank has been buying government bonds in ever increasing quantities, ie monetizing debt. It recently raised the upper limit of 10 year rates to 0.50% and precipitated an immediate market attack on JGBs.  The BOJ panicked and is trying to talk rates lower, but it really can't defend its YCC policy for much longer - fundamentals always win in the end. I mean, with inflation at 4% who other than BOJ will buy 10 year bonds at or under 0.50%?  

Here's where Japan stands today: 
  • Huge Debt
  • Low Growth
  • High Budget Deficits
  • High Inflation
  • Artificially Low Interest Rates
This is as black of a swan as I have ever seen.  And keep in mind this: Japan is the world's third largest economy, and a major source of cheap liquidity found sloshing about in the global financial system (the yen carry trade).

Look in the East. That's not the Sun rising, it's a flock of black birds with unusually long necks.

Tuesday, January 17, 2023

The Budget Deficit

In yesterday's post I suggested that the budget deficit should be eliminated, or at least sharply reduced.  Here is a chart of budget surplus/deficit as percent of GDP - see below.


 As we can see, the US is running deficits not seen since WWII - a highly dangerous situation that IMHO could  lead to bankruptcy if not immediately and firmly addressed. May I remind readers that Greece went bankrupt during the PIIGS crisis (2010-12) when its budget deficit reached 15%.

In my previous post I suggested some tax increases, which prompted readers to suggest spending cuts, instead - without being specific, however.  Therefore, here's another graphic showing sources of federal spending and revenue.

Almost two thirds (63%) of federal spending is mandatory, basically Social Security, Medicare and Medicaid.  It would be political suicide to cut spending there.  Another 8% is net interest on the debt, also impossible to cut without defaulting.  Therefore, 71% of spending cannot be reduced, except in extremis.

This leaves defense spending at 14%, which could surely be slashed - but only at the cost of ending Pax Americana. Not exactly an option at this time.  Thus, we are down to the last 16% - which is everything else from NASA to FDA. It's obvious that not much can be cut there and it won't make much of a difference on the deficit, anyhow.

Moving on to the revenue side, it becomes immediately obvious that corporate income tax at 9% is very, very low.  The corporate tax rate today stands at an almost all time low of 22.50%;  compare this to 45% in 1984 when Ronald Reagan was President, for example.  In extremis, again, yes corporate taxes should be raised sharply.  And I do mean sharply - back to 45%.

 Individual taxation is a huge 53% and, when combined with payroll taxes at 32% (ie social security contributions) it means that individual labor is a taxation pool where 85% of revenue comes from - and don't forget that many States impose their own individual income taxes, too. Yes, I'm all for a much higher "millionaire tax", particularly on stock options, benefits, expense accounts, etc. but mostly for social justice reasons, since it won't raise much revenue.

This leaves the 6% "other" portion, which by definition won't do much to raise revenue - unless the US institutes a national sales tax/VAT scheme and raises taxes on fuels.

It is easy and popular - populist even - to suggest spending cuts like the Republicans are doing right now.  But it just won't do much for the deficit.  The real answer is this, again in extremis:

  1. Pass a "balanced budget amendment" that will reduce the deficit to zero in an organized way.  It should initially focus on reducing the primary deficit (ie before interest expense) before moving on to the entire deficit.
  2. Raise taxes as above.
  3. Cut spending where it could be done.


Monday, January 16, 2023

The Debt Limit

The debt limit is almost upon us - yet again.  Lots of hot air will be expelled by Republicans and Democrats alike, but they both ultimately ignore the fundamental problem: the US is under a tremendous debt burden and it should not be increased any further. In other words, in extremis, I am all for NOT raising the debt limit.

The chart below shows how the debt/debt limit has exploded upwards, particularly in the last 5 years or so, rising almost vertically.


Perhaps the threat of  a debt default will bring Congress and the White House to their senses and - finally - agree on a sane fiscal policy that erases the soaring budget deficit by cutting spending AND raising taxes. 

Here are some ideas on the latter:
  • Impose a national sales tax
  • Raise gasoline/diesel fuel taxes by $1/gallon
  • Raise corporate taxes
  • ... and here's a really radical one: tax capital gains as regular income, from all sources


Thursday, January 12, 2023

Corporate Debt Burden - Share Buybacks And Dividends

A period of almost 15 years of exceptionally low interest rates prompted corporations to borrow rather than issue new shares to finance themselves (in fact, many listed companies have been buying back stock in record amounts).  Debt of the non-financial corporate sector presently stands at $13 trillion, a record high (see chart below).


What is more important than total debt is the debt burden versus a company's cash flow. It now stands at a very, very hefty 25 times (see chart below).  

Another way to look at this is that corporate cash flow is a mere 4% of total debt (= 1/25);  compare this to current interest rates for 3 month commercial paper and things are becoming tight, indeed (see chart below).


What the chart shows is that typical financing costs are now exceeding corporate cash flow, forcing corporations to take appropriate measures - eg stop share buybacks, at the very least. Buybacks reached a lofty annualized rate of $1.1 trillion and have since eased off (see chart below - 3Q2022 latest data)


Buybacks are very sensitive to financing costs and the business cycle, of course, so I fully expect that they eased further during the last 4 months, and will continue to do so for as long as interest costs exceed cash flow.

Another issue is dividends, also highly correlated to cash flow. Companies absolutely hate to reduce dividends, so they are less volatile than buybacks.  They reached an all time high in 2022 (see chart below).  But with debt service costs now exceeding cash flow I cannot see how dividends will remain immune for much longer. 


In sum: as interest costs keep rising, or even if they stay at present levels for more than a few more months, companies will be forced to cut share buybacks sharply and even reduce dividends.  What this means for stock prices is pretty obvious.

Note: Charts from Yardeni Research

Wednesday, January 11, 2023

Inflation Hits Japan. Yes, Japan!

The Japanese business establishment just got a shock: Fast Retailing Co. Ltd announced salary increases as high as 40% for its employees at retailer Uniqlo. After decades of stagnating wages, Japan's employers must now contend with a combination of sharply rising cost of living and a shrinking labor pool (sound familiar, USA?). 

 With 130.000 employees, Fast Retailing is a veritable giant, and its outsized wage hikes will certainly affect employment and salary patterns across the entire nation.  Keep in mind, Japan is the world's third largest economy (it is sometimes easy to forget that!), so what is going on there has global significance.

Inflation is now a real concern for the Japanese.  Just look at what is happening in Tokyo, considered a major indicator for the country as a whole (see chart below).


The Bank of Japan is definitely concerned.  It recently raised the interest rate band for 10-year JGBs to 0.50% driving rates to the highest in 8 years (see chart below).  Though BOJ was quick to deny it is abandoning its super easy monetary policy, actions speak louder than words.


Here's my bottom line thought: If even Japan is now on the inflation bandwagon, then the world has turned 180 degrees from deflation/easy money to inflation/tight money.  The implication for financial markets going forward long term is profound - never mind the short term back-and-forth imbedded in CPI, etc announcements - that's just so much noise.

We have entered a New Era: there will not be any more QE's, interest rates are not going back to zero, equity valuations (P/E's mostly) will be adjusted lower, government budgets will increasingly reflect a new reality.  Massive deficits will no longer be tolerated (as the UK snafu showed us a couple months ago) and if governments try to go that way they will be immediately punished.

Japan is showing us the way.

Monday, January 9, 2023

Bill Gates Walks Into A Bar...

Averages can be very misleading.  Bill Gates walks into a bar so, on average, everyone is now a multimillionaire.  That's why we should focus on the correct average, depending on the situation - in the case of the bar it should be the median, not the mean.

Likewise with employment cost statistics, though admittedly it's a more complex situation.  Last Friday markets were cheered because average hourly earnings of all private employees grew only by 4.6%, lower than the expected 5.0% (see chart below).  The Fed is supposed to take this into consideration when it decides on its rate policy going forward.


But, is the Gates/bar analogy important here?  It appears so - look at the next chart.  

Employees in Professional and Information industries are amongst the most highly paid (large Green and small Blue bubbles on the very left) and they were precisely the ones that got laid off, therefore skewing the averages lower.  In addition, the Leisure and Hospitality (Red bubble) plus the Education and Health sectors (Purple bubble) have amongst the lowest paid employees and added the most people, further depressing average earnings.  Those are means, not medians.

In the bar analogy, a bunch of bankers and IT engineers walked out and lots of housemaids and hospital attendants walked in... on average, everyone just became poorer.  But does this say anything about wage inflation? Nope, nothing at all. 


For a much better understanding of wage pressures, the Atlanta Fed publishes a median wage growth tracker using microdata from the Census Bureau - see chart below.  Yup, as expected it is much higher.  Wall Street is cheering, but the Fed itself knows better.


Thursday, January 5, 2023

History Will Rhyme Again

There are two immutable Laws Of Nature:

  1. Disorder always increases (Second Law Of Thermodynamics)
  2. History Rhymes
Take those two together and you quickly come up with waves, Elliott theories, Fibonacci ratios... even astrology.  Basically, in order to maintain systems/economies/markets/life on an upward trajectory we need to keep adding ever increasing amounts of energy/resources.  The higher we go the more the energy and resources that are required. At some point the system becomes unstable because the net returns are not enough to justify the energy/resource expense, and we get recessions/depressions/crashes.  The details may be different each time, but the outcome is the same: History will Rhyme.

I believe we are presently at such a Rhyming Point.  

To demonstrate my thesis I created a monthly log chart of S&P 500 and added 5 and 10 year moving averages (blue, red lines).  Breaches of the MA lines are rare, particularly of the 10-year.  It takes a lot of excess, indeed, to create the need to reset to such a large extent.

In the last 50 years there have been only 3 such events: in 1974 inflation was roaring due to the oil shock and President Nixon resigned in disgrace. In 2001 the Dotcom mania bubble burst spectacularly and in 2008-09 the Great Credit Crisis brought the entire global financial system within a hair of total collapse, saved only by the massive intervention of central banks which bailed out the private sector.

S&P 500 Monthly Log With 5 And 10 Year Moving Averages

What about today?  The COVID crisis prompted governments and central banks to create unprecedented amounts of QE cash (aka debt) to be distributed to everyone willy-nilly (aka helicopter money).  The immediate result of QEmax was an enormous bubble in everything from stocks, bonds, real estate and commodities, all the way to loony stuff like meme stocks, cryptos, SPACs and NFTs.  Shortly thereafter we got consumer inflation rising at the fastest pace in 40 years.

Has the excess been corrected? To some degree yes, but certainly not enough and certainly not in everything.  The loony stuff has been first to come down, as it always does, but the "core" excess is still very much with us.  Large cap stocks, long bonds, real estate, consumer spending and the labor market are still flying high, by historical norms.  For example, S&P 500 is nowhere near its 10-year average (currently at 2.655), never mind breaching it. 

Interestingly, the Fed has completely changed its tune when it comes to markets, but markets appear to be ignoring it.  In yesterday's minutes' release the Fed goes out of its way to underline its resolve to keep rates high for as long as it takes to bring inflation down to 2% or less.  Yet, markets don't seem to care.  Why?

Here's what I think: investors/speculators believe that rates have come up so much and so fast that a significant recession is a certainty, and that the Fed will thus be forced to quickly reverse its monetary tightening, probably within a couple of months. Wrong!  Consumer demand is strong, the labor market is strong (wages are rising fast, too) and inflation is transitioning from goods to services.

The Fed cannot afford to blink: with debt/GDP at record highs the US simply cannot afford high inflation and high interest rates.  The Fed MUST kill inflation - period.  And it will certainly err on the side of too tight instead of loosening too soon.  It is still, in some ways, still too loose: there is just way too much cash still sloshing out there (just look at the O/N reverse repo!) and it is not being absorbed fast enough to make a serious dent on inflation.

Bottom line: There is still too much excess out there and it WILL correct. Again.

Tuesday, January 3, 2023

The Fed's Reverse Repo: Scrap It!

HAPPY NEW YEAR!!

The Fed runs an overnight deposit facility for banks and money market funds known as the O/N Reverse Repo (ONRR).  Technically it is a sale and buyback operation (repo = repurchase) of Treasury securities on the Fed's portfolio. Practically, it is a deposit backed by Treasuries. The Fed currently pays interest at a very substantial 4.30% in order to keep its monetary policy tight, ie maintain short term rates in line with its target of around 4.25-4.50%.

The amount deposited just reached yet another all time high of $2.55 trillion - yes, that trillion with a T. Window-dressing is always a factor at year end, but it is still an absolutely enormous amount of money being parked, ultimately at the expense of the American taxpayer.


Doing a quick calculation, at this level it costs the Fed $110 billion annualized in interest.  Some observations:

  • The $110 billion is, of course, new money that enters the system, ie it is a form of QE.  Since the Fed is removing approx. $95 billion/month in its QT operations, the ONRR makes QT considerably less effective on the whole (12x95-110 = $1.03 trillion vs $1.14 trillion of liquidity withdrawn).
  • The interest rate paid at 4.30% is now higher, and significantly so, than the average earned by the Fed on its Treasury portfolio.  In other words, the Fed is running the ONRR at a net loss. The chart below shows the ONRR rate (blue) and the current yield on 10-year Treasuries (red).  And keep in mind that the Fed is likely earning substantially less on its overall portfolio than the current yield of 10 year bonds.  If I had to guess, I would say the Fed has a negative carry of around 100 bp (1%) on its ONRR, or around $25.5 billion per year (again, current levels annualized).         *** Addendum: I'm being too conservative here: the likely negative carry is DOUBLE that.  I just looked at the Fed's 3Q22 income statement and I calculate a current yield on its portfolio of only approx. 2%.  This means the Fed is borrowing $2.55 trillion at 4.30% and lending it out to the Treasury/mortgage originators at 2%... do the math: 2.55x(4.30-2.00) = $58.6 billion negative carry.

Digging a little deeper into the Fed's 3Q22 financial statement we see that their Net Interest Income (NII) (interest received minus interest paid) for the first 9 months of 2022 came to $83 billion and for the 3Q alone to $13.8 billion - meaning that while the first two months were running at $34.6 billion each, the third quarter NII collapsed by -60%.  And it's - essentially - all because of the enormous drain of the ONRR.

If we annualize everything at current levels, the Fed will end up its next 12 months with a NII of around $25 billion, a very far cry from $117 billion in 2021.  Given that its expenses run at approx. $10 billion/year, the Fed will only make around $15 billion net - at best. 

Keep in mind, the Fed remitted $107 billion to the Treasury in 2021 and it looks like it won't even come close to that in 2022 and certainly not in 2023 - UNLESS:

It makes no sense to me to keep running the ONRR like this and it should be scrapped.  How should the Fed keep its monetary policy on track, instead?  Easy: expand QT and kill three birds with one stone: 
  1. Fight inflation by reducing money supply more aggressively
  2. Stop increasing money supply via paying interest on the ONRR
  3. Stop losing money on the negative carry.