Thursday, December 29, 2022

Of Eggs, Baskets And Apple Eggnog

 When it comes to investing there are two schools of thought:

  • Don't put all of your eggs in one basket
  • Put all your eggs in one basket and watch it very, very carefully
In decades past Warren Buffett, the world's most prominent investor, followed the first rule choosing to invest in a largish number of carefully selected smaller companies; many of them were not even listed on any exchange.  But as assets at Berkshire Hathaway expanded exponentially it became impossible to invest so much capital without taking large, strategic positions in huge listed companies.  In effect, Mr. Buffett now follows the second rule and does so in a very big way, indeed.

Another of Mr. Buffett's rules was that he never invested in anything that we could not understand or appreciate fully (his investment in See's candy is legend).  This rule has also now been tossed out.

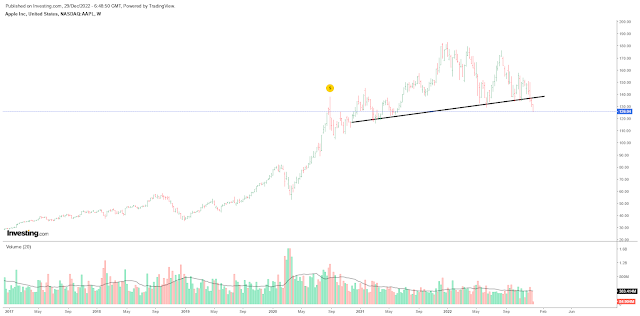
To the point: Berkshire's largest position, at an astonishing 37% of its portfolio, is Apple. Another 11% is invested in Bank of America and 10% in Chevron.  At 58% it's one hell of a large basket.  Furthermore, if any one person claims to truly understand what goes on in Apple... or inside a huge commercial/investment bank... good luck to him/her (another 12% is invested in Coca Cola and Kraft Heinz combined - that's more along his old style).

So, to a very large extent Berkshire Hathaway, and by direct inference Mr. Buffet's future legacy, has now  become hostage to Apple.   It's the largest company in the world by market cap: $2 trillion.. and looking at its chart I get a very, very queasy feeling.  It feels as if Apple is the only thing keeping S&P 500 from crapping out (ok, Microsoft is helping, too).


I'm afraid Mr. Buffett is going to end up with lots of broken eggs... and lots of Apple-flavored eggnog for the New Year.  

Wednesday, December 28, 2022

Reality Is A B!+@#

 Hello All, hope Santa was kind and y'all found something better than a lump of coal in your Christmas stocking - markets sure didn't.

I'm bemused to read the usual end of the year articles on markets: "Annus Horribilis", "Good Riddance To '22", etc.  Was 2022 such a bad year? Yes, if you look at 12 months only it was.  Everything from stocks, bonds, cryptos, and even real estate in some areas, suffered negative returns when measured from top to bottom.  But I think this is misleading and a roundabout way of saying/hoping that 2023 will be much better. "Can't have two bad years in a row, can we?" is the inference. I disagree.

Why? Because 2022 came after a period of eye-popping rallies in everything, including ridiculous items like meme stocks, NFTs and SPACs, all soaring on the back of money creation on an unprecedented scale.  If we look at markets from a slightly longer perspective and use S&P 500 as a yardstick, we get the following:

Jan. 2019 - Jan. 2022 : +100% in a mere 3 years!!

Jan. 2019 - today: +56% in 4 years, still a very significant rise for such a short period. 

Keep in mind that the long term average annual performance is +9.5% and, more significantly nowadays, 6% when adjusted for inflation.  By these metrics, SP500 is still far away from the average.

In other words, all that happened in 2022 was that the ridiculous froth came off - and that's it.  By historical standards equity valuations are still high (see chart below) and in no way discount a possible recession or an extended period of near zero GDP growth going forward.


There is still so much money sloshing around in the system in the US, EU, Japan and even China, that consumer demand remains strong, keeping the economy afloat and prices elevated.  But central banks everywhere are removing liquidity, even if slowly right now.  The US is on a definite QT path, the EU is going to start very soon and Japan surprised everyone last week by raising JGB rates - this only leaves China, but as the yuan is not a global currency (yet) it does not impact global liquidity patterns. 

Meaning: I project that 2023 is not going to be kind to markets.  Probably not as bad as 2022, but not a good year, either.  

We may all have visions of sugarplums dance through our heads - but reality is almost always such a b!+@#...

PS In these days of Quant Everything it is pretty rare for classic chart/technical analysis to work so well.  To Mr. Musk's woe, it worked.. big time (top Head and Shoulders pattern). Told you so... :)


Wednesday, December 21, 2022

Home On The Range Is Now Out Of Range

 The foundation of the American Dream is buying a home of one's own, most commonly by putting 10-15% down and financing the rest with a 30-year fixed mortgage. This dream is now out of reach for most middle class Americans.

For one, prices have soared 50% in just 3 years (chart below). Incomes most certainly haven't.


Case Schiller National Home Price Index

Making things even worse, mortgage interest rates have also jumped. It now costs twice as much to make a typical mortgage payment than in 2020 (chart below).

This situation has put a dampener on new home sales;  new homes for sale are now at the highest level since the real estate bubble back in 2006 (which precipitated the Debt Crisis of 2008-10).


New One Family Homes For Sale

The median home price now stands at $455.000, massively up from $318.000 just three years ago.  Since shelter costs make up 32% of the Consumer Price Index basket, bringing down home prices is crucial in controlling inflation.  Give it another few months.. builders will eventually have to start selling inventory at lower prices.  High interest rates are making things difficult for them too - they can't carry their inventory easily any more.

Tuesday, December 20, 2022

Japan Rings The Bell

They say that they never ring a bell in markets (to signal a time to buy or sell), but I disagree. Markets and their participants always ring bells, it's just a matter of having your ears tuned to the right frequency.

Point in fact: The Bank of Japan just rang a very loud bell by allowing the 10-year bond yield to rise from 0.25% to 0.50% (see chert below). It marks the end of zero/negative interest rates for the world's third largest economy behind the US and China, so it's not to be ignored.  


Ten Year Japanese Government Bond Yield

Economists and analysts have been largely ignoring Japanese markets, since they were mired in a disinflationary cycle for decades. Thus, the sudden decision to raise market yields came as a shock.  Why did BOJ do this? IMHO because it sees inflation becoming a serious issue, even in Japan, and must now act proactively to contain it (see chart below).


Japan Inflation (Blue) and 10-Year Yield (Red)

Japan's debt/GDP ratio is easily the highest in the developed world, now topping 260% (see chart below). And even though most of it is domestically owned, such enormous debt poses a serious threat if inflation is allowed to rise unchecked and therefore drag interest rates upward.


Japan Government Debt/GDP Ratio

Bottom line: If even Japan is taking global inflation seriously, what about the rest of us? Should we pay attention to the bell, or are we going to ignore it hoping that inflation is just a temporary phenomenon?

Sunday, December 18, 2022

How To Kill Inflation For Real

One of these days the Fed will openly admit that high inflation was caused by the massive creation of money in 2020-21. It may then also admit that keeping all this extra cash sloshing around is keeping inflation high (duh).  

Here’s a chart of M3 as a percentage of GDP: lots more money chasing goods and services that are growing at a slower rate than money is going to result in …drumroll…. Lots of inflation. Pretty obvious, right?

M3 Money Supply - Percentage Of GDP

In dollar terms, during  2020-21 the Fed created a massive extra $7 trillion - and most of it is still on its own balance sheet, which expanded from $4 trillion to $9 trillion in the same time. Clearly, the Fed needs to get rid of all - or most - of this extra cash in order to tame inflation. It is currently engaging in quantitative tightening (QT) at a maximum of $95 billion per month, a pace that will take 50 months to shrink its balance sheet back to 2019 levels. Can and should it speed up the pace? Yes it can, and yes it should.

Wait a minute, you say. Won’t withdrawing all this extra liquidity damage the economy? No, it won’t because lots of this extra cash isn’t being put to productive use. Instead, it just sits as overnight reverse repo with the Fed (O/N RR), ie banks and money market funds are parking it. The amount of O/N RR is currently at $2.1 trillion (chart below), and the Fed pays 4.30% or $95 billion per year, to borrow this money back from those it issued it to.  Nuts.

Fed O/N Reverse Repo At $2.1 Trillion

So, what is the Fed waiting for? Why isn’t it draining this inflation-producing liquidity lake as fast as it can? What is it afraid of? I don’t have a definitive answer, but I think the Fed is concerned that it will cause a liquidity crunch and precipitate a stock market crash. 

Sure, that’s a possibility. But letting inflation continue largely unchecked will soon create a much more ominous problem: the distinct  possibility that bond interest rates will rise unchecked and result in a vicious cycle that ends in sovereign bankruptcy.

For now, the path is clear: drain away at least $2 trillion as soon as possible and stay the course on increasing interest rates. 


Where Are The Customers’ Yachts?

 Today’s post title comes from a classic book about Wall Street greed written in 1940 by Fred Schwed. The story goes that a broker was giving a client a tour of the NYC marina, pointing out all the yachts berthed there. “This is our CEO’s yacht, that’s our sales manager’s boat and that one over there belongs to the head of a competing firm”,  and so on and so forth.  Finally, the client turns around and asks “So, tell me, where are the customers’ yachts?”

I was reminded of this book by the photo below showing two yachts side by side. One is a 26m “run of the mill” motor yacht typically owned by the mere “rich” and the behemoth behind it is Solaris, a mega yacht owned by Roman Abramovich. For further perspective, the second photo shows Corsair II, a yacht built in 1892 for JP Morgan. Draw your own conclusions on socio-economics.

Rich vs. Ultra Rich Today

The Ultra Rich 130 Years Ago

For reference, Corsair II displaced around 800 tons, today’s typical 26 m yacht comes in at around 200 tons (it’s mostly light fiberglass), while Solaris tips the scales at 11.200 GRT. Yup, money can’t buy you happiness, but it sure helps!

And while on the subject of ships, here’s a chart of container shipping rates.  They have now completely retraced their crazy spike, yet another sign that the REAL global economy is cooling fast. I’m betting there are several shipowners out there who are starting to sweat.

Freightos Container Index


Thursday, December 15, 2022

The Fed Cannot Afford To Blink

The Fed cannot afford to blink in its fight against inflation, and the reason is oh so simple: the US government cannot afford to pay high interest rates for much longer.

Here are the oh so simple charts.

  • Federal debt is now at 120% of GDP, the highest since 1945 when WWII required massive debt funding.  No such reason today.

Federal debt to GDP

  • Inflation has caused interest rates to spike.  Real rates (inflation adjusted) are deeply negative, so investors will soon start turning up their noses to US bonds - unless inflation goes down fast OR interest rates go up very significantly.

Inflation (red) and 7-year Treasury yield (blue)
  • With debt so high, the US simply cannot afford higher interest rates, definitely nowhere near 7-8%.  It would, basically, cause the US to go bankrupt.
==> Therefore, the Fed MUST bring inflation down WHATEVER IT TAKES. 

If you think the Fed will blink... good luck!  Let me put it another way: a recession is one heck of a lot better than bankruptcy.

Wednesday, December 14, 2022

November Inflation

 Inflation for November was announced yesterday lower than "expected" causing an initial jump in markets, which was almost immediately scaled back. 

Headline CPI was up "only" 0.1% for the month, but... averages are nasty critters.  Here's what lies beneath (month over month figures):

Headline = +0.1%

Shelter (32% weight in the index) = +0.6% 

Food (14%) = +0.5%

Education (5%) = +1.0%

All of the above are zooming higher, much faster than anticipated. 

So, how did we end up with a mere +0.1%? Once again, energy (ie gas at the pump, mostly) came to the rescue with an oversize price drop.

Energy (8%) = -1.6%

For some reason unknown to me medical care prices downshifted as well

Medical Care (7% ) = -0.7%

Finally, commodities other than food and energy (21% weight) came in at -0.5% almost entirely because used cars dropped by -2.9%.

In sum, inflation is easing but certainly not across the board. When you scratch the surface inflation is very, very strong and worrisome.

Tuesday, December 6, 2022

The US As Japan

What will the future bring for the US economy? I'm talking long term here, not the next quarter.

Here's my model: Japan.  The chart below is Japanese GDP in current yen - the economy has been "stagnant" (I very much prefer "stable") for 25 years. And, honestly, I think that's the best case scenario because, unlike the US, Japan is a socially homogeneous society that very rarely exhibits the kind of fractious politics common in America - at least after the Meiji Restoration in 1868.


 Can the US survive a flat economy for decades? Yes, but only if its politicians and society realize that the alternative is much, much worse, and cool down their extremism on both sides.

There's another reason for the US to embrace a flat economy: Global Climate Change. Or, as I prefer to call it, Human Biosphere Annihilation. In short, if our species doesn't halt Permagrowth it is headed for extinction.  


Monday, December 5, 2022

Refi To The Rescue? Nope.

Note: Charts from Yardeni Research 

Unlike Europeans, most Americans own their homes.  They finance their purchases with fixed rate mortgages which they can refinance relatively easily if/when interest rates move significantly lower from where they originally borrowed the money.  Thus, refinancing can be a  pretty good source of additional spending money - when available. 

Since interest rates usually drop significantly during recessions, refinancing is a type of cushion which allows homeowners a bit of wiggle room to weather a down cycle.  But, I think not this time. You see, mortgage interest rates were at historical lows for at least a decade before they zoomed up. There just aren't as many borrowers today with higher interest costs as previously, even if rates go crashing back down in the near future.


Understandably, refinancing activity has collapsed down to near zero.

And even though homeowner equity is at record levels due to higher real estate prices, owners won't be able to tap into it to bolster their finances any time soon. At least, not at interest rates that will make the exercise financially sensible.

With unemployment still near record lows and with ongoing robust job openings Americans are still ok.  But if/when a recession hits and people start losing their jobs en masse (already happening in  high tech) the refi window will not come to the rescue.


Thursday, December 1, 2022

Soft (ish) Landing Interpreted

Chairman Powell yesterday confirmed the Fed will slow the pace of its interest rate hikes from 75 bp to 50 bp.  Though it was expected, his statement created a strong relief rally in all markets, which chose to focus on that part of his statement, instead of these:

  • The Fed will keep hiking to a level higher than previously targeted
  • Inflation is expected to remain high for longer, necessitating a restrictive policy well into 2023 or further.  His reasons include structural shifts, such a demographics and changed employment patterns post COVID.
  • He expects a soft(ish) landing for the economy, rather than a deeper recession.
How do we interpret his pronouncements? For me, it's this: inflation will last for years and won't revert to 2% soon, or ever, and the economy will be weak(ish) for the foreseeable future.  In my book, that's called stagflation, though not the same as in the turgid 1980s.  Putting it in numbers, I expect inflation around 5-6% and real GDP growth around 0-1%.  

What does this mean for markets, assuming Mr. Powell is correct? For one, the yield curve inversion will soon reverse course and become more normal/flat around 5%.  For another, a period of near zero economic growth will hit equity valuations by lowering P/Es going forward.

Looking at real GDP growth for the last 70 years (chart below) we can observe a change in the nature of US economic activity. During 1950-80 the economy was highly cyclical, with frequent recessions and booms. During 1980-2000 there were fewer boom-bust cycles and a more consistent, albeit lower, level of economic growth.  Finally, from 2000 onward the economy was much more consistent, except for the Great Debt Crisis, though average growth was even lower. In percentages, average growth has declined stepwise from approx. 5% to 4% and now around 2.5%.


If our future is even mildly stagflationary, where should equity P/Es be? For perspective, here is a chart going back to the 1980s when they averaged around 12X.  Versus today's 17x, a reversion to 12x implies a 30% correction ON AVERAGE.  Of course, markets overshoot, and during long, drawn out bear markets they can also become despondent, so I would not be surprised to see multiples as low as 7-8X.

Chart: Yardeni Research

High inflation, high(er) positive real interest rates and near zero growth are very strong headwinds for equities, particularly "growth" stocks that do not pay consistent dividends. 

Wednesday, November 30, 2022

Be Careful What You Wish For

 Seems like everyone in markets is hoping for a recession so that the Fed will stop raising rates.  They point to the yield spread between 10 year and 2 year Treasuries as an accurate predictor of recessions.  The spread is now at its most negative in 40 years, and a quick glance at the chart below confirms that a yield inversion accurately predicts recessions (grey areas in the chart).


From a fundamental perspective, it makes sense to expect a recession.  Sharply higher prices for consumer essentials like energy, housing, food and transportation means that disposable income is curtailed for other expenses such as clothing, electronics, vacations, dining out, etc.  So, yes, a recession is more likely than not.

But, "markets" had better be very, very careful what they wish.  For one, squeezing available incomes and raising unemployment in today's America is downright dangerous.  The middle class has evaporated, replaced - mostly - by the working poor;  and they cannot afford to see their incomes eaten away by inflation, because they simply cannot make ends meet living paycheck-to-paycheck.  Labor actions are already in the works where unions still have a toehold, but if this negative income/expense balance continues for much longer there will be serious social trouble.  At the very least, expect higher wage demands even where there is no unionization.

The government/Fed's record breaking largesse during COVID via QE helicopter money is now long gone, spent away on the likes of FAANG-type services and punting on scams like meme stocks, cryptos and NFTs.  Moreover, the Fed has - finally - started to drain the excess liquidity at the rate of $95 billion/month.  Not fast enough to kill inflation quickly IMHO, but this is money that will be increasingly "missed" from the economy.


Americans' Savings: Easy Come, Easy Go

Bottom line: I don't think this will be a recession like all others.  It won't be the quickie down-and-up of old but a shallower and more prolonged affair, possibly marked by social unrest and political upheaval. Markets: Beware what you wish for!

Fed Update:  Mr. Powell confirmed that rate increases will moderate from 75 to 50 bp and sent markets into a strong relief rally.  He also, however, pointed out that structural changes in the economy, demographics and employment patterns mean that inflation is now more difficult to bring down quickly, requiring restrictive policies for a longer time. He thinks that a “softish” landing is possible, rather than a deep recession. Another name for it? Mild stagflation…


Monday, November 28, 2022

Is The US A "Safe Haven" Or A "Powder Keg"?

Every time there is some sort of global upheaval in markets or geopolitics the US benefits from a stronger dollar and a rally in Treasury bond prices.  It has been thus for decades, as the US is viewed as a safe haven for capital from all over the world. 

Is this view still valid?

In my opinion, no it is not.  The US should no longer be taken for granted as a safe haven;  instead, it should be viewed more as a risk factor than anything else, a powder keg that could potentially blow up spectacularly. This is not a recent development, it has been a long time in the making.

  • For one, it was the US itself that caused the Great Credit Crisis in 2007-10.  Yes, there were other economies that followed the same unsound path: loose money, substandard lending practices, real estate excesses and unbridled securitization of loans and derivatives.  But, it was the US that was the main culprit and it was the US that subsequently "printed" trillions to save its banks, brokers, funds and insurance companies from default - well, most of them anyway. The deleterious effects of that massive QE are still with us, even if the even more massive COVID era QE has far outdistanced it.
  • The US is now amongst the most highly indebted nations in the world, with public debt to GDP at 121%, an enormous increase from just 30% in 1980.  The debt ratio has accelerated the most during the Great Debt Crisis (see chart below), precisely because the government "saved" the private sector banks, investment banks, etc. by assuming their debt - foolishly, in my opinion.


  • Going back further, the US economy has become emasculated, wasting away its manufacturing muscle by shifting it abroad, mostly to China.  As I said before, manufacturing is the fountainhead of all technology, of all high value-added economic processes. According to the Bureau of Economic Analysis, US manufacturing now accounts for 11.5% of GDP, down from 27% in 1960.  Crucially, manufacturing employment is now a mere 7% of total, down from 30% in 1960.  US manufacturing leadership is now limited to aircraft (Boeing) and military equipment.  Not good.
  • The loss of manufacturing jobs has all but eliminated the solid American middle class, creating a socio-economic chasm between the working poor and the ultra rich.  The political consequence of this divide are becoming apparent (Trump/MAGA) and dangerous (storming of the Capitol, rise of the far right).  Unthinkable previously, the US can no longer be considered a politically stable nation.
  • As is common in nations, societies and economies that are losing their leadership edge, financial speculation in the US has increasingly replaced healthy, productive economic activity.  American tycoons are now mostly owners and top executives of hedge funds, investment banks, and until recently, all manner of crypto/NFT firms.  That's not a healthy sign, it marks an economy that makes money from trading paper, instead of innovating and producing. 
  • One final observation: a sure sign of an Empire in decline is that its supremacy is increasingly challenged by second or even third rate powers, who would never dare do so before. Iraq, Venezuela, Afghanistan, North Korea, Turkey and, of course, Russia are nipping at Uncle Sam’s heels with increasing frequency, if with questionable success. But the mere fact that they are doing so speaks volumes.
So, yeah, the US is no longer a safe haven in my book.  And unless American leaders wake up soon, they will end up wondering why the proud nation has become a has-been.

Sunday, November 27, 2022

That’s Oil Folks


The recent slight drop in inflation caused a wave of optimism that we are out of the woods. All markets rallied and the Fed decided to slow down the pace of raising interest rates.

But, let’s take a closer look at the constituent parts of inflation, shall we? The following chart from the WSJ tells it as it truly is: the drop in inflation came 100% from lower energy prices. Core inflation remains mostly unchanged and high, and so does the food component.


To make this clear, here is another chart: energy price inflation came down from 42% yoy - the highest in 40 years - to a more manageable 17.5%.


And why did energy prices come down in the US? Because the government released an unprecedented amount of oil from the Strategic Petroleum Reserve, increasing local availability of cheaper oil to domestic refiners thus lowering gasoline prices from $5.00 to $3.60 per gallon. Gasoline is the largest component of energy CPI thus… lower overall inflation.


This unprecedented drawdown in the SPR is not sustainable, of course. If continued at October’s rate, America’s strategic reserves would empty completely in a mere 17 months. In fact, there are signs that the drawdown is slowing down in November - after the midterm elections, of course. Now, if I were of a suspicious nature I would say that lowering gas prices and inflation was a political ploy designed to shore up the Democrat’s showing in the midterms. 

One way or another, we will soon be back to normal (whatever that is), the oil drawdowns will cease and the SPR will need to be filled up again, reversing the downward pressure to an upward one.

As Porky used to say - almost - “That’s Oil Folks!”


Friday, November 25, 2022

More On The Creaking Treasury Bond Market

In a recent post I pointed out that liquidity in the secondary market for US Treasury securities is at the lowest point in years, creating serious problems for dealers, traders and the Treasury itself.  I did some more data mining in SIFMA  and came up with the chart below.

You can see that the average daily volume in all Treasury securities (bills, notes, bonds, TIPS) as a percentage of all marketable Treasuries outstanding (ie excluding those held in the Social Security accounts) is at the lowest level ever.  The big drop in activity came about after the Debt Crisis in 2008-09 and has been falling steadily since.

This drop in activity is very worrisome, particularly now when the spike in inflation has led to sharply higher interest rates and an increase in new bond issuance to cover higher budget deficits and debt service payments/refinancing.


Why did activity drop in the secondary market?  Partially, it is due to the sharply higher amount of bonds held by central banks, particularly the Fed, which now owns 6 times more Treasuries than in 2008.  Such holdings don't trade, so the percentage traded has come down - but this can't explain everything.

Amount Of Treasury Securities Held By The Fed

Something else is going on… it could be the near zero interest rate environment that held for such a long time sapped all desire to trade - there was very little price volatility for years on end. Also, investors had no reason to sell their older higher coupon bonds since they could not replace them.

No matter the reason, low liquidity and low volume is troubling and could create serious problems for the government’s finances.


Inflation and Wages - A Follow Up

Following up on yesterday's post on how inflation is eroding the buying power of the average American and European wage earner and the upcoming strikes in key sectors like rail, mail, education and health.

It has been decades since unions flexed their muscle - indeed, unions have become emasculated. In the US private sector only 6.1% of workers are unionized today, a far cry from almost 35% in 1960.  The primary reason is the de-industrialization of the US/West, particularly after China became the world's factory.  I am certain that this shift of production from West to East (it started with Japan, remember?) is one of the stupidest socioeconomic decisions made by all Western leaders, bar none. Pardon the "stupid", but as a trained engineer I understand very well how production drives R&D advances and quickly leads to technological supremacy.  Lose your technological edge and you destroy your high value-added economy and your prosperity - period.

The loss of manufacturing jobs emasculated the entire middle class, now but a shadow of its former glory.  And along with that, has come the rise of populist politics, and politicians promising to Make America Great Again.  It is happening everywhere: in the US, France, Italy, Brazil, Austria, Poland, Hungary... it is no accident that Germany, the only Western economy still boasting a large and solid manufacturing base, has not fallen victim to populism - at least not yet.

It was a matter of time, then, that something would give and social unrest would follow.  Soaring inflation and loss of real income is now threatening to throw the West into a vicious cycle of social unrest.  It is no accident that Russia/Putin is taking advantage of this situation, hitting Western economies in their soft underbelly: energy, food and transport.  And it is still early in the game.

What should the West do? Here's a list, from immediate actions to longer term:

  1. Substantially raise minimum wages - at least to cover inflation.
  2. Do everything necessary to kill inflation immediately: raise interest rates at least at or near inflation levels AND get rid of excess liquidity ASAP.
  3. Promote saving instead of spending. Pressure banks to raise deposit interest rates.
  4. Raise corporate taxes, enforce minimum tax policies and invest the proceeds in alternative energy technologies, public transport, technical education and R&D.
  5. Provide serious incentives to bring factories back. Perhaps impose trade/import restrictions.
  6. Promote "buy local" policies, with tax incentives.
  7. Seriously evaluate the consequences of getting rid of WTO, replacing it with bilateral/multilateral trade agreements. 
If the West - and by West I mean 70% USA, 20% EU, 10% Japan - does not act immediately, it will fail spectacularly and suddenly.  There is no time left for navel gazing.


Thursday, November 24, 2022

Real Wages Eroding Fast, Strikes On The Horizon

With inflation running hot in the US and Europe, labor unions are preparing massive strikes not seen in decades.  

US railroad employees are set to strike next month, though the federal government will likely step in and impose labor terms, as it has the right to do in order to prevent the economy from grinding to a halt (40% of all goods move by rail and many commuter trains use private railroad tracks). In the UK rail workers are also set to strike in December, joined by university professors, teachers nurses and mail workers.

Can you blame them? In the US consumer inflation is rising much faster than pay raises, resulting in negative real wage growth (see chart below).  

Real Average Hourly Earnings - Annual Percent Change

Lower/middle income workers feel the pinch much more, since a greater portion of their earnings go to buy essentials like food and transport where prices are rising faster than overall inflation: Food and beverages are up 10.6% and transport up 11.6%, while overall CPI inflation is up "only" 7.8%.  For them, wage erosion is closer to minus 5% - 6% instead of 3%.

Service workers in Amazon or Twitter may be laid off in droves without immediately causing an economic upheaval, but essential workers are a different matter altogether.  Expect more labor actions to surface in the immediate future.

Tuesday, November 22, 2022

It's Deja Vu (All Over Again)

 Very short post today.

The gut feeling I get from all markets these days is that I've seen it all before, specifically during 2007-08.

Back then the Debt Crisis started slowly at the very edge of the risk/credit/real estate spectrum, ie subprime loans for speculative type properties.  Some mortgage brokers started going under, then specialist mortgage lenders (remember Countrywide?) and - finally - the doodoo hit the fan all at once: venerable investment banks who had bought and securitized loans and derivatives went bankrupt or were bought/bailed out for peanuts, seemingly overnight. The Fed saved the day by providing massive liquidity in amounts that looked immense - back then.

Today, the "edge" of the credit/risk spectrum is in cryptos and their associated exchanges and lenders.  They are now going under leaving behind losses in the billions.  Since the financial system is highly interconnected, however, I'm waiting for the next domino to fall, and it won't necessarily involve cryptos.

Once the Risk switch is turned to the OFF position all manner of critters are going to be rushing for the exit doors.

Monday, November 21, 2022

COP27 Ends In Failure

The COP27 conference just ended in abject failure, as leaders failed to agree on the mitigation of emissions from fossil fuels and arresting global warming. Not surprising. God help us and our children, because global leaders won’t.

Below, relevant charts. 

Fossil Fuels Are 80% Of Our Global Energy Consumption


CO2 Emissions Have Risen 800% In 70 Years


Global Land-Ocean Temperatures Up 1C In 40 Years


Heat Map In 1950

Heat Map In 2022

All charts are alarming, of course, but the last one is particularly so.  It shows that Arctic temperatures are rising the fastest,  4C+ over average.  This means:

  • Polar caps are melting fast, raising sea levels
  • The Siberian Arctic tundra holds immense amounts of trapped methane near its permafrost surface. Methane is up to 80 times more damaging as a greenhouse gas and its release will act as the most powerful accelerant of global warming/climate change, much more than CO2.  It means that we may see climate and habitat disasters happen within years, not decades.  

Friday, November 18, 2022

The Most Important Market In The World Is Creaking

The stock market gets the glory (incessant publicity), but the most important market in the world is the bond market, particularly US Treasurys. Everything, and I do mean everything, is ultimately based on it. It hasn’t always been so, but ever since the abolition of the gold standard in 1970’s, and more recently the emergence of shadow banking and the effective abolition of bank reserve requirements has led to an explosion of debt. 

Yes… Sudden Debt…

Obviously, the proper functioning of the US Treasury market is of paramount importance: liquidity, breadth, depth, transparency and regulatory oversight are the cornerstones of any market and are taken for granted for Treasurys.  Lately, however, something is seriously wrong as the chart from a very important FT article shows.


Liquidity, measured as the amount of a single trade that can be executed without seriously moving the market up or down,  has deteriorated to dangerous levels at the very time that the size of the market has quintupled. In 2010 liquidity stood at almost $800 million and today at just $100 million.  As a ratio of the total market, liquidity has collapsed 97.50% from its 2010 levels. Another way to look at it: for a bond trader it is now 42 TIMES more difficult to execute trades in US Treasuries - in equivalent market size. 

In practical every day terms it's not as bad as that because a chunk of Treasuries sit at the Fed's balance sheet, around $5.5 trillion worth. Still, it's bad enough.  Furthermore, the Federal Reserve Bank is ultimately... a bank!  At the end, it too has to take into account how heavily exposed it is to its borrowers and how liquid is its portfolio.

As a bond market professional, this liquidity plunge is really scary.  It could create enormous price volatility in the market, a possible repeat of what we saw in UK gilts recently, but magnified many times over.  If it happens, it would necessitate the massive intervention of the Fed in the form of another QE, at a time when we need the exact opposite (QT).to tame inflation. 


Wednesday, November 16, 2022

Fed Funds Projections

Markets seem to be monothematic these days: it's all about the Fed.  How fast will it raise rates and, even more crucially, how high will it raise them from today's 3.75-4.00% band.  With this in mind, here's a chart I came up with with data from the CME's Fed Funds futures market

The blue bars (left scale) show the Fed Funds rate and the orange line (right scale) shows the highest probability associated with this rate, as implied from the futures market.


Interpreting the chart, the market is betting that the Fed will immediately temper its hikes to 50 basis points next month, giving that scenario an 81% probability, and will subsequently raise by only 25 bp, but give this a lower probability of 50%. Further, the chart says that rates will top out at 5.00% by March and stay constant until late next year, but with ever lower certainty.  To be clear, the orange line involves the rate that shows the highest probability - others are for lower or higher rates.


Saturday, November 12, 2022

We’re Sorry If You’re Starving, But…

 The iconic Harrod’s of London decided to go all out this Christmas and, in cooperation with Dior, transformed itself into a giant ultra luxury gingerbread house bedecked with thousands of lights showcasing products that are far beyond the reach of even the merely rich, never mind the middle class. 

The manager of the store said - on camera! - that he’s truly sorry for those Britons that are in trouble, but Harrod’s only caters to the 0.1% of the ultra rich. Never mind being socially incredibly deaf and blind, a supersize retail establishment like Harrod’s cannot long survive with the custom of only 68.000 Britons plus some visiting tourists. I mean, if you are one of other 99.9% do you now feel welcomed? Do you really want to set foot there, even if only to buy a trinket? Is the Harrod’s brand now one that you want to be associated with?

The fact is that a whopping 25% of all Britons, some 20 million, cannot afford to heat their homes this winter: for them, it’s heat or eat. Yet, the 0.1% store says they’re truly sorry.  Like Dickens’s Tiny Tim from A Christmas Carol, 20 million cold and underfed Britons could crowd outside and stare at the store windows in wonderment. Hopefully, they won’t decide to start throwing bricks.


Wednesday, November 9, 2022

The All-American Sandwich

 Final results for yesterday's mid-term elections are still being calculated, but this picture (see below, from Reuters) speaks volumes.  It's the House of Representatives map, awash in red.  Yes, its pretty misleading because the large population centers with their large numbers of House seats are actually blue, but it is troubling nevertheless.


Basically, the map says that America's affluent liberal coasts are completely at odds with everyone else who is poorer and socially conservative, or even regressive. It's a recipe for a social/national disaster: America is not a single country but a federation of States.  Why should the approx. 40 red States stay in a union with the other 10 if they hate each other? The Reds produce most of the food, energy, minerals and forestry products - what do the Blues make that is essential to survival?

America is a very fat red sandwich with two very, very thin slices of blue bread.  Perhaps the red "meat" may decide it does not need bread, after all?

For comparison, see below the same map for the 1978 mid-terms.  Why 1978? Because like today, Jimmy Carter was a deeply unpopular Democratic President faced with an energy crisis and soaring inflation. Yet the nation was much more balanced and united, even if angry.


Tuesday, November 8, 2022

Stage Management

 I cannot shake the feeling that for the past couple of months the US stockmarket and the price of gasoline at the pump are being manipulated, stage managed if you like, ahead of today's crucial mid-term elections. 

I strongly believe that these mid-terms are the most important since at least WWII.  The confluence of economic, financial, social and cultural issues is creating an unprecedented political tinderbox for the US, far beyond anything we have experienced in our lifetimes.  I think President Biden is right in saying that "democracy is at stake", though it doesn't necessarily follow that voters should cast their ballots for Democrats.  Indeed, America faces far more important issues than Blue-Red politics.

Back to stage management: there is no question that gasoline prices at the pump are being suppressed, mostly by massive domestic oil releases from the Strategic Petroleum Reserve, which has now fallen by 45% to 40 year lows (chart below).


What is very peculiar is that while gasoline prices are being kept low, diesel fuel (also used for heating) is soaring to new highs (chart below).


US Prices for Diesel (red) and Gasoline (blue) 

The spread between the two has reached unprecedented highs (chart below).


Spread Between US Diesel And Gasoline Prices Reaches Record High

Unlike Europeans, Americans don't drive many diesel cars, preferring gasoline ones instead.  The country consumes three times more gasoline than diesel/heating oil.  Therefore, voters are not experiencing "pump shock", just now. However, diesel is essential for moving goods in trucks and trains, as well as heating homes where natural gas is not available.  Therefore, it plays an important role in shaping consumer inflation, even if voters don't see it everyday driving to and from work.

As for stage managing the stockmarket: while tech companies are taking a massive beating, broad averages like SP500 and the ever popular Dow 30 are not.  Why? Because (a) oil companies are soaring (b) "defensive" shares like pharma are holding up and (c) Apple, the biggest biggie of them all, is also holding up, comparatively.

The election will be over today. No matter what the result, I believe stage management will also be over today.  Let's see how markets fare then.  


Sunday, November 6, 2022

Irreverent Interelationships

 From our weird comparisons department: are these two charts related? And if so, what can they tell us about the future of the US stock market?

 Note: Apple has the highest market capitalization, and is by far the largest component, of S&P 500.


Percentage Of US Population Using Social Media


Price Of Apple Stock


Thursday, November 3, 2022

Shipping Indexes: The Real Economy

The real economy moves lots of stuff around, most of it in ships.  Raw materials like coal, iron ore, fertilizer and grains are transported in bulk carriers and finished products in containerships.  The vessels are chartered either long-term (time charters) or on a voyage basis (spot).  Spot charter rates are, therefore, among the best current economic indicators since they reflect the actual supply/demand balance for raw materials and finished goods.

Moreover, unlike financial markets shipping rates are almost impossible to manipulate;  there are simply too many players and too many destinations, with none dominating. Thus, it's a pretty "pure" market.  Even though futures contracts for freight rates do exist, they are not very popular or active.  Therefore, shipping is one sector of the real economy that hasn't yet become "market-ised" and "financial-ised" (unlike, say, energy or pollution emission permits). 

Recently the pandemic created massive disruptions in the global supply/logistics chain and caused spot charter rates to rocket upwards (see charts below).


Baltic Dry Bulk Carrier Spot Charter Rates


Freightos Container Shipping Index

After nosebleed levels, charter rates are now rapidly coming back to the ground, albeit  still somewhat elevated vs historical averages. This price action has apparently caused the head of AP Moeller Maersk, the world's largest containership and logistics company, to comment that he expects Europe to go into recession very soon, perhaps followed by the US as well. 

Yet another global recession warning from the head of one of the largest real economy companies in the world.  Couple it with high inflation, which the Fed and ECB are clearly NOT willing to deal with decisively with strong QT, and we are left with the prospect of an anemic economy saddled with high inflation.  Not good news for financial markets, aka The Uninvestible Universe.


Wednesday, November 2, 2022

The Fed: Superman Or Mini-Me?

 If you read the financial and mainstream press you get the impression that the Fed has embarked on the most aggressive interest rate hikes ever.  But even a cursory look at the facts (see chart below) shows it just isn't so, even when we add the75 basis point hike expected today.  Moreover, everyone is already talking (hoping) about the Fed tapering its hikes after today.


Fed Funds (Blue line) and Inflation (Red line)

The reason for this rate anxiety, the view that rate hikes are perhaps already excessive, is simple: rates started from zero and hikes look excessive. In fact, they are small given how high inflation is right now. Real Fed Funds (Fed funds minus inflation) are at record negative territory (see below) and are thus having very little, if any, impact on fighting inflation. Instead of being a Rate Superman, the Fed is still a mere MiniMe.


 Fed Funds Minus Inflation

Once again: focusing only on interest rates is wrong, wrong, wrong.  The real cause of inflation is excessive liquidity created by the Fed itself via massive QE in a very short period of time, and which is still sitting on its balance sheet undrained (see chart below).


Fed Balance Sheet Assets

If one needs more proof that liquidity is indeed excessive, he/she need look no further than the Fed's own O/N reverse repo, now at a massive $2.2 trillion (see chart below).  That's money that banks and other major institutions have no other use for and are electing to park it overnight with the Fed.


Fed O/N Reverse Repo

The Fed is currently draining liquidity at a maximum $90 billion per month.  Judging from the size of the reverse repo alone, this pace is too slow to have any meaningful impact on inflation and should be increased immediately, perhaps to a level approaching the initial rate at which liquidity was added during QE, ie around $500-750 billion per month.  

It certainly won't reach that level, but $90 billion/month is clearly too little - a monetary policy MiniMe when it comes to inflation fighting. 

I can't help but to say it again: its all in the QT - and I really wonder why almost no one is talking about it, at least not widely. I'm becoming suspicious in my old age :)