Wednesday, February 22, 2023

The Fed Was 17 Months Late In Raising Rates

 The Fed printed a gusher of money during 2020-21, and then hid its head in the sand ignoring inflationary pressures, labeling them “transitory”.  Finally, they woke up from their dream state and started raising rates all in a rush.  How much time did they lose, how far behind the curve were they?  The short answer is they were at least 17 months late - way too late in my opinion. 

Here's a chart.

  The blue line is the yield on the 2 year Treasury, which is anchored by the Fed funds rate.  The red line is the yield of the 10 year Treasury which is entirely dependent on the market.  Notice how the red line starts to creep higher starting in August 2021, even as the 2 year remains flat.  Meaning, the market was already pricing in higher inflation, way before the Fed started raising rates in October 2022; that's a whole 17 months where the market was telling the Fed to get its head out of the sand - to no avail. 

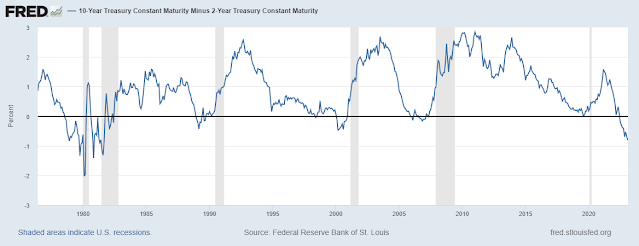
By the time the Fed acted, the 10-2 spread was already at 100 basis points (the black arrows).  The Fed has been playing catch up ever since, causing the spread to - finally - go negative.  Yet, rates are still lower than headline inflation and the ocean of liquidity created by the Fed is still almost entirely untrained.  The “easy” part of inflation moderation is now finished as fuel prices have stopped dropping, and it is highly likely that inflation will, if anything, start rising again as higher wages kick in.  And that’s when the Fed will, at last, truly wake up.


Monday, February 20, 2023

If The Fed And ECB Were "Regular" Banks They Would Be Bust

 The Fed and ECB are now running huge operating losses PLUS enormous mark to market losses. To wit:

  1. There is a wide gap/mismatch between paying high short term rates (eg on the Fed's reverse repo) and low returns on their bond portfolios.  This is a classic borrow short - lend long problem, exactly the same as the Savings and Loan Crisis of the late 1980s.
  2. Central banks are holding long term bonds on their balance sheets that are now priced much lower than what they bought them for.  The unrealized mark to market losses are in the trillions of dollars/euros.
This article explains things pretty clearly.  I wonder how much longer the monetary world will continue to operate as if the Emperor's clothes are real...


Friday, February 17, 2023

Inflation Will Not Come Down Until And Unless Money/Liquidity Is Drained Away By The Fed

 Inflation has come down from the highs registered last summer, but most recent data is showing that it's becoming "stickier" at uncomfortably high levels. For example, PPI released yesterday came in at the highest reading since last June.

This is prompting various analysts to revise upwards their terminal Fed Funds target rate, now expected to peak at 5.25-5.50% from 4.50-4.75% currently.  That's 0.25% higher than previously expected.

At the risk of my becoming repetitively boring, that's not enough.  Until and unless the Fed truly bites the bullet and starts to drain liquidity in earnest, ie to sharply reduce the size of its own balance sheet, inflation won't come down rapidly.  Why? Because inflation is a monetary phenomenon, more money = more inflation.

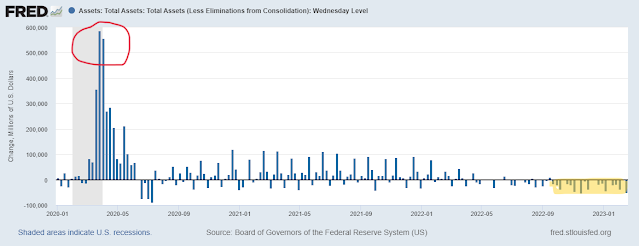
Looking at monthly changes in the Fed's assets, we see the pumping of huge amounts of cash into the system, as much as $590 billion per week, during the COVID era (see chart below-red circle).  By comparison, the draining of this flood is extremely timid, at around $ 20-25 billion/week (yellow highlight).


Once again, then: if the Fed really wants to fight inflation it better look at its own house first and start selling bonds from its portfolio.

Tuesday, February 14, 2023

Be My Valentine

 On this Valentine Day index lovers must send lots of chocolates and roses to AAPL and XOM.  The pair are a spike lover’s delight.


EXXON


APPLE


Friday, February 10, 2023

The 10-2 Treasury Yield Spread Conundrum

The 10-year minus 2-year Treasury yield spread is considered one of the best recession predictors. When it goes negative, ie when the 2-year note yields more than the 10-year bond, a recession soon follows (chart below, recessions in grey). Will the past repeat?


I think there is something different and unusual about this episode of yield curve inversion. 
  • For one, it comes after a very prolonged and unprecedented period zero/negative short interest rates.  Meaning, short rates were extraordinarily low and had a ways to go higher before they normalized. By comparison, long rates had not fallen as much. Therefore, it is logical for the spread to be more negative than otherwise.
  • Secondly, there is a growing feeling that the Fed will be successful in quashing inflation in the next few months, and thus long rates need not be as high as current inflation implies. Therefore, while short term rates are high, long rates are still low ---> spread more negative than otherwise.

Markets are definitely acting along those two concepts above.  Are they correct?  I have no idea, but if they are not we are going to see a major "disillusionment" drop in all markets.

Putting it another way, the near record negative spread is more an indicator of markets defying the Fed (and common sense) than anything else. It’s an indicator of excessive speculative optimism which may be proven unfounded.

Thursday, February 2, 2023

Personal Saving Rate At All Time Low

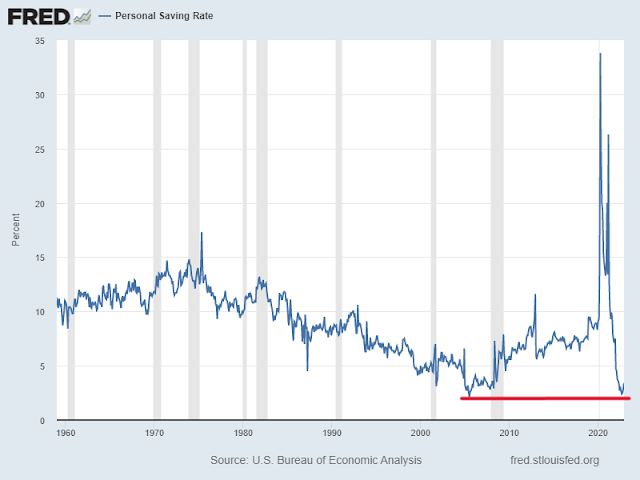
Right before the Great Debt Crisis of 2006 - 10 Americans' personal saving rate had dropped to an all time low around 3.5%.  After rebounding significantly to around 7.5-9% (excluding the COVID period) it has now collapsed back down to all time lows (see chart below).


Personal Saving Rate At All Time Low

Another way to look at it is that Americans spend 96.5% of their income, the highest percentage in the world.  This statistic goes a long way in explaining the current resilience of the US economy despite soaring inflation and slow wage growth.  But this resilience is hollow: people just can't keep raiding their savings forever.  And given sharply higher interest rates they can't keep piling on more debt.

In fact, what keeps piling on are warning signs that all is not well.  But, as usual, people are ignoring them.


Wednesday, February 1, 2023

National Financial Conditions Index And Inflation

The Chicago Fed publishes a national financial conditions index (NFCI) which rises when conditions tighten (eg when interest rates rise and risk appetite decreases).  Obviously, as financial conditions tighten the economy faces headwinds and slows down, while inflation also eases (at least theoretically).

Here's a chart of NFCI (blue line) and CPI inflation (red line).


NFCI And Inflation

An immediate conclusion here is that financial conditions are still rather loose (blue line below zero) while inflation is still near historic highs.  And that's despite the Fed's rapid increase in interest rates.

If history is any guide, it will take much tighter financial conditions to bring down inflation to more manageable levels.


Tuesday, January 24, 2023

The Upcoming Debt Service Crunch For Households Will Impact Spending In A Big Way

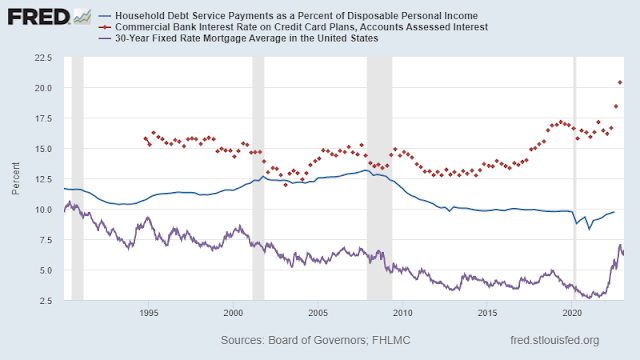
Consumer spending accounts for 68% of US GDP, so as the consumer goes so goes the economy.  In the last 10 years consumers saw their debt service payments go down very significantly as interest rates collapsed to near zero;  as a percent of disposable income household debt service in 2021 fell to near 8% from a high of 13% in 2008 (see chart below - blue line). 

This allowed consumers to boost spending on other items (eg streaming services) and, importantly, created a massive pool of money available to drive individual speculation in anything from meme stocks, cryptos and NFTs to index funds. 


With interest rates now soaring this process is reversing.  Mortgage rates have jumped from 2.5% to 7% and credit cards from 16% to 21% (see chart above - purple line and red dots). Data on debt service lag by at least a quarter, so it cannot be seen on the chart, but it is certain it will jump to at least 11-12% of disposable income.  Notice how such levels were previously associated with recessions (grey areas on the chart).

Despite inflationary headwinds, overall consumer spending has remained relatively high, likely because employment is still very robust and wages are rising.  Also, household debt is still pretty low compared to 10-15 years ago, so adding debt may support spending.  But this can't last; the first signs of retrenchment are already visible, mostly at the loony edges of speculation.  Will this transit to other, conventional areas of consumer behavior?  I think so - big layoffs at Amazon, Meta, Spotify, etc. can only be explained in the light of lower household demand.  Likewise for Tesla's reduced prices.

Lower consumer spending = lower GDP = recession/zero growth.  After 4Q22, which may come in surprisingly higher than most think (Atlanta Fed GDPNow is projecting +3.5% vs market expectations of +1.5-2.5%), the consumer and the economy will have to deal with serious headwinds, debt service being a major issue.  Markets don't seem to take this into account and are back on their "risk-on" mode.  Even loony stuff is jumping - a pretty sure sign that speculators are back into action.  I believe they will be proven wrong.

Monday, January 23, 2023

Beware Of Japanese Black Swans: Minister Warns About Precarious Public Finances - And He's Right!

Japan's Finance Minister just warned of increasingly precarious finances. The combination of enormous debt, rising inflation and higher interest rates will severely impact public finances in a country already struggling with a rapidly aging population and near zero economic growth.

While zero growth at a time of climate change and habitat destruction is desirable in my opinion, it is  poison for debt service.

 Here's a series of charts.


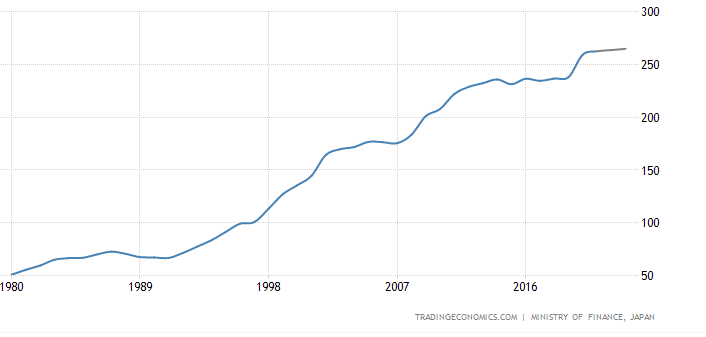
Debt To GDP At 250+%


Stagnant GDP 


Persistent Budget Deficits Require Constant New Borrowing

Inflation Rises To 4%, A 40+ Year High

The Bank of Japan (BOJ) has been engaging in the most massive "Yield Curve Control" (YCC) policy in history.  YCC is a polite (obfuscatory?) way of saying that the central bank has been buying government bonds in ever increasing quantities, ie monetizing debt. It recently raised the upper limit of 10 year rates to 0.50% and precipitated an immediate market attack on JGBs.  The BOJ panicked and is trying to talk rates lower, but it really can't defend its YCC policy for much longer - fundamentals always win in the end. I mean, with inflation at 4% who other than BOJ will buy 10 year bonds at or under 0.50%?  

Here's where Japan stands today: 
  • Huge Debt
  • Low Growth
  • High Budget Deficits
  • High Inflation
  • Artificially Low Interest Rates
This is as black of a swan as I have ever seen.  And keep in mind this: Japan is the world's third largest economy, and a major source of cheap liquidity found sloshing about in the global financial system (the yen carry trade).

Look in the East. That's not the Sun rising, it's a flock of black birds with unusually long necks.

Tuesday, January 17, 2023

The Budget Deficit

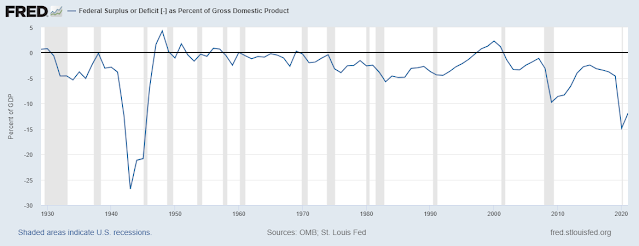
In yesterday's post I suggested that the budget deficit should be eliminated, or at least sharply reduced.  Here is a chart of budget surplus/deficit as percent of GDP - see below.


 As we can see, the US is running deficits not seen since WWII - a highly dangerous situation that IMHO could  lead to bankruptcy if not immediately and firmly addressed. May I remind readers that Greece went bankrupt during the PIIGS crisis (2010-12) when its budget deficit reached 15%.

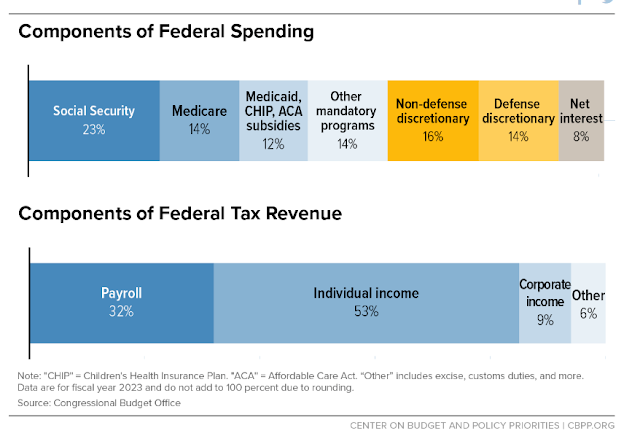
In my previous post I suggested some tax increases, which prompted readers to suggest spending cuts, instead - without being specific, however.  Therefore, here's another graphic showing sources of federal spending and revenue.

Almost two thirds (63%) of federal spending is mandatory, basically Social Security, Medicare and Medicaid.  It would be political suicide to cut spending there.  Another 8% is net interest on the debt, also impossible to cut without defaulting.  Therefore, 71% of spending cannot be reduced, except in extremis.

This leaves defense spending at 14%, which could surely be slashed - but only at the cost of ending Pax Americana. Not exactly an option at this time.  Thus, we are down to the last 16% - which is everything else from NASA to FDA. It's obvious that not much can be cut there and it won't make much of a difference on the deficit, anyhow.

Moving on to the revenue side, it becomes immediately obvious that corporate income tax at 9% is very, very low.  The corporate tax rate today stands at an almost all time low of 22.50%;  compare this to 45% in 1984 when Ronald Reagan was President, for example.  In extremis, again, yes corporate taxes should be raised sharply.  And I do mean sharply - back to 45%.

 Individual taxation is a huge 53% and, when combined with payroll taxes at 32% (ie social security contributions) it means that individual labor is a taxation pool where 85% of revenue comes from - and don't forget that many States impose their own individual income taxes, too. Yes, I'm all for a much higher "millionaire tax", particularly on stock options, benefits, expense accounts, etc. but mostly for social justice reasons, since it won't raise much revenue.

This leaves the 6% "other" portion, which by definition won't do much to raise revenue - unless the US institutes a national sales tax/VAT scheme and raises taxes on fuels.

It is easy and popular - populist even - to suggest spending cuts like the Republicans are doing right now.  But it just won't do much for the deficit.  The real answer is this, again in extremis:

  1. Pass a "balanced budget amendment" that will reduce the deficit to zero in an organized way.  It should initially focus on reducing the primary deficit (ie before interest expense) before moving on to the entire deficit.
  2. Raise taxes as above.
  3. Cut spending where it could be done.