The US stock market is making new highs, but if you look closely it is doing so with diminishing breadth. The number of new highs minus new lows is very weak, meaning that new highs are achieved through fewer and fewer index heavy stocks. For the benchmark S&P 500, yesterday there were only 36 more highs than new lows - chart below.

Interestingly, it looks to me that one of the major “culprits” in shaping (window-dressing?) the capitalization-weighted S&P is Tesla, which is now #8 on the list and accounts for 1.45% of its total performance. In days when top shares like Apple and Amazon are down or flat, in comes Tesla charging with 4-6% gains and, voila, new highs. I’ve been noticing such shenanigans for weeks now.
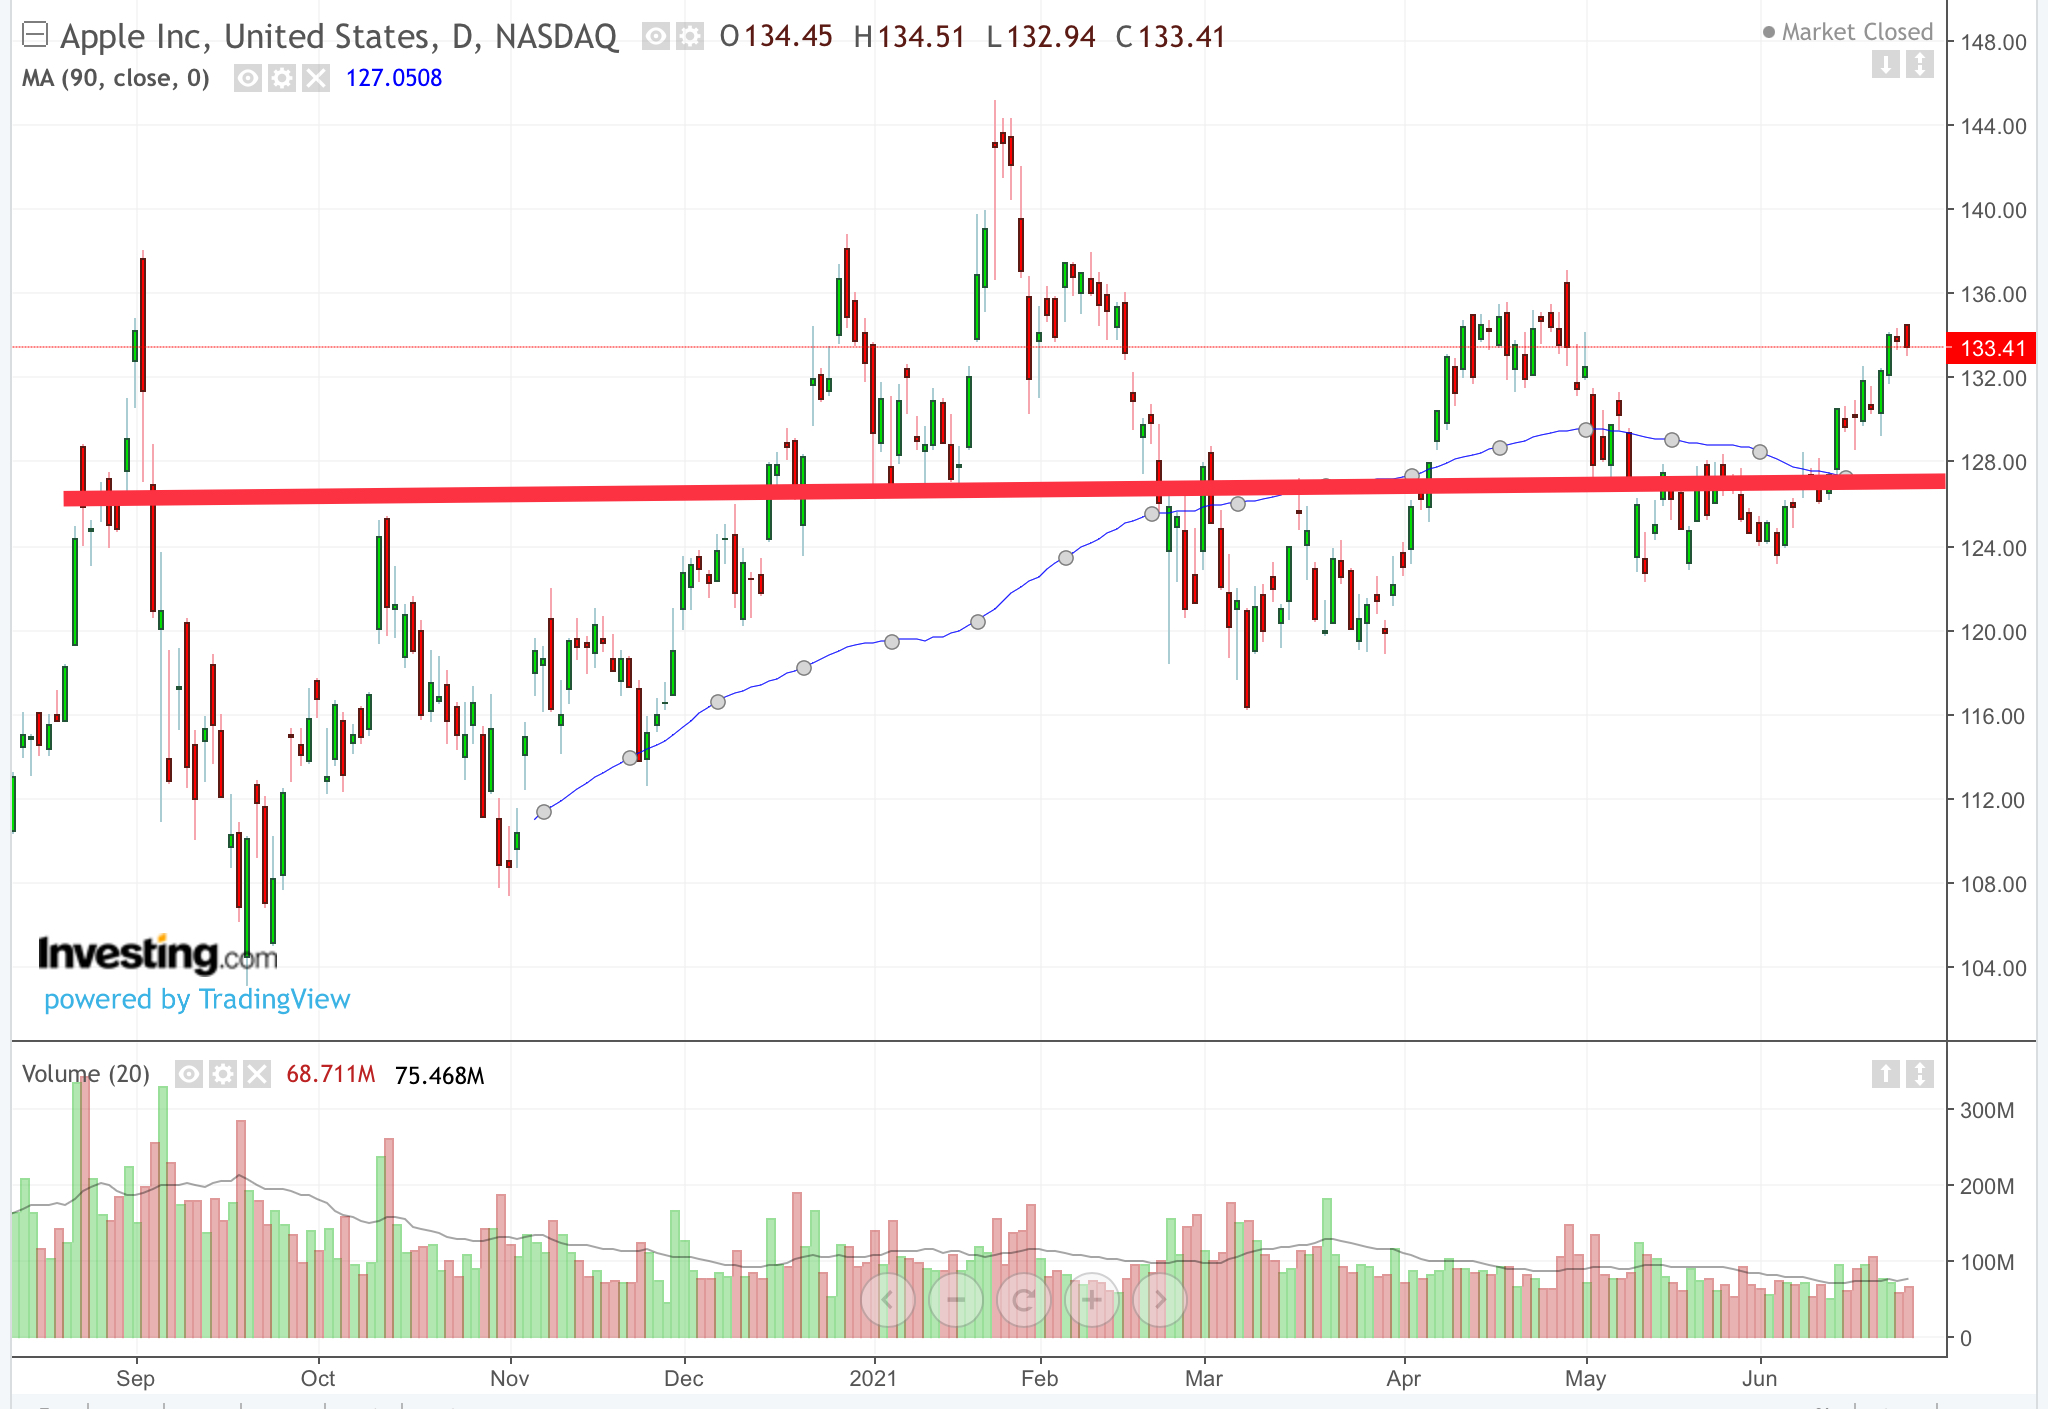
For example, #1 Apple, which accounts for 6% of the index, has been just oscillating around its 90 day moving average for almost a year now.
Same thing is going on in Amazon, #3 on S&P accounting for 4.2% of the index. Going nowhere for 12 months, also just oscillating around its 90 day moving average.

Notice how daily trading volume has also subsided for both.
But Tesla? It is sitting right at its 90 day moving average after a previous massive 350% 12 month rally.

Conclusion? This market is getting very narrow (fewer new highs) and thinning out (lower volume). Both are signs of internal weakness, no matter what the index headline is doing.
PS As of yesterday the top 10 companies in S&P 500 accounted for 28% of the index value. That’s 2% of the companies… talk about a narrow market 😱
No comments:
Post a Comment