Sunday, November 16, 2025

Treasury Basis Trade

The US Treasury basis trade consists of buying a Treasury bond in the cash market and selling the underlying futures contract. The difference in returns, the arbitrage, is the “basis”.

The cash bond position is financed via  overnight repo, while the futures contract has its own leverage built in.

Because the basis spread is very small these positions are in the hundreds of millions, even billions.  Therefore, huge leverage is applied 10X, 20X even 100X. The basis trade has become a staple for dozens of hedge funds, most all of them based in tax havens (eg BVI).

Here’s a chart with ESTIMATED amounts, put together by AI from various sources.

In just 5 years the basis trade has apparently grown tenfold! Is this concerning? Yes, it is. The amount of Treasury debt utilized in basis arbitrage is now huge and helps absorb part of increased Treasury issuance - but it can evaporate in short notice. For example, repo rates could rise, or futures margin requirements  increase.

For sure, if the basis arbitrage becomes unprofitable then a huge supply of Treasury bonds will have to find alternative investors.


Friday, November 14, 2025

The Pools of 1929

 In the months before the Crash of 1929 the phenomenon of “bull pools” gained great popularity. A bunch of wealthy individuals would pool their money and proceed to pump up stocks on the NYSE, often with the cooperation of the floor specialists.  The manipulation was rampant and, astonishingly, often public: many pools were announced in the press in advance in order to induce wide participation by the gullible public.  It was a kind of Ponzi scheme, where those who got in early and got out in time made money.  After the pump came the dump, of course, and the rest lost everything.  Think "meme stocks".

What is today's equivalent?  To me, at least, the constant announcement of enormous triangular AI investments between the usual suspects looks like bull pool redux.  Time will tell.


From TIME magazine, May 30, 1932

Pools. Any Wall Streeter knows, but few Senators do, how pools are run. Because the risks are great, the pool’s sponsor usually invites only his richest friends to form a syndicate. Each shares in the profits (or losses) in proportion to his subscription. Each usually makes a cash deposit for the pool manager to use as margin in his trading operations. Each is pledged to strict secrecy. With dictatorial powers, the pool manager begins accumulating stock, buying a little more each day than he sells. Stock is dumped if the price rises noticeably. When the manager has the stock he wants, publicity is shot out, bullish rumors about the company appear, the stock is “tipped,” for it is now advantageous to whisper the existence of the pool. The stock is churned over & over, bought & sold to attract attention. When outside buying begins, the pool manager drives up the price by concentrated buying. Outside enthusiasm grows, amateur traders hear a big rise is in prospect. Most pools do not play for large advances but for small profits on large blocks of stock. When the profit in sight seems satisfactory, the pool manager starts selling more than he buys, transactions increase by leaps & bounds. Canny chart readers sell too, for they readily spot the end of a pool movement by very heavy turnover with little change in price.

Wednesday, November 5, 2025

Sociopolitical Risks

 Following the Democratic sweep in yesterday’s elections, it is a good time to ponder socioeconomic risks facing the US and their likely impact on markets.

In a nutshell, America has never been more politically divided and economically polarized than today. Mr. Trump’s presidency is not its cause but a result of this division, a result of decades of drawing apart. On could even say that this era is reminiscent of the time before the Civil War.

I believe markets have not taken into account the risk of a sudden Black Swan appearing over America. And we do know that Mr. Trump is especially fond of “swan barbecue”…

Tuesday, October 28, 2025

Zero Day Options

 According to CBOE data almost 60% of all SP500 option daily volume now comes from the most extremely speculative and leveraged instrument of them all: Zero Days To Expiration options, or 0DTE for short. While they do have uses for institutions (eg index fund balancing), they are now used mostly as lottery tickets.

Apparently, these have now become very popular with retail “investors” who have piled into them in force during the last few months and are causing large distortions in volatility.

Since options market makers must hedge their intraday exposure on 0DTE, they are forced to buy (or sell) the underlying index or individual stocks, magnifying the intraday moves.

This explains the recent erratic behavior of indexes - they seem to spike or fall off a cliff within seconds.

One more layer of unregulated leverage - what could possibly go wrong…?

Addendum: after writing the above I realized I had seen this before, figuratively speaking. This is the 21st century equivalent of “bucket shops” which were hugely popular with punters in the early part of the previous century. The similarity is really uncanny.. see Reminiscences Of A Stock Operator.


Monday, October 20, 2025

Margin Debt Soars

The amount of margin debt in the US has soared to a new high of $1.13 trillion in September (data: FINRA). Some will say that we should look at it as a percentage of total market cap, and I agree. 

However, I have a different point to make. Look at how fast margin debt has increased in just a few months: up 30% since the beginning of the year and 50% in the last 12 months.  This is an indication of froth created mostly by retail speculators who are piling in to make a quick buck.

Does not look good to me…


Saturday, October 18, 2025

Leverage and Risk Transmission Mechanisms

 The Great Debt Crisis of 2008-10 was the result of inordinate leverage created by arcane derivative instruments like debt tranches, Collateralized Mortgage Obligations (CMO), Collateralized Debt Obligations (CDO) and Credit Default Swaps (CDS). Some of them were even further leveraged, eg CDO squared and cubed.  The degree of interconnection was extraordinary and once one or two dominoes fell, the result was a disaster.

Fast forward to today. Are there similar leverage and risk transmission mechanisms in place? Yes, there are.

1. Exchange Traded Funds (ETFs): once a tiny portion of markets, they are now very popular with retail investors and speculators alike. The biggest ETFs are index trackers, and they MUST buy or sell to follow the underlying index. There are literally thousands of them, with assets estimated at $11 trillion for the US market alone - that’s a massive 20% of total market cap. To make it worse, a mere 10 companies account for 40% of the entire S&P 500 index, which itself is capitalization weighted. Therefore, a very large percentage of stock owners who MUST follow the index are currently sitting atop an extremely narrow market. The operational market leverage risk is unprecedented. By the way, many of the ETFs are 2x and 3x trackers, using futures and options, so there is even more leverage involved.

2. Algorithmic trading. By definition, algorithmic trading is mechanistic. Create a “formula” and follow it, again and again. A massive 70-80% of all daily trading volume in US equities is now algo based and, more worrisome, some 40-45% of this is retail. Algo is, therefore, another layer of “hands-off, brains out” market participation. Like all algorithmic models, algo trading is optimized to perform well under current conditions and is based on current assumptions. This is strongly reminiscent of the debt “tranching” model which was based on flawed assumptions and precipitated the Great Debt Crisis.  

Put everything together: ETFs, algo and an extremely narrow market. The leverage risk transmission mechanism is, in my opinion, very dangerous and prone to a China Syndrome incident. Can anyone throw a switch to prevent it? Can it be done fast enough to stop a meltdown?

Final word: a market exhibiting the above characteristics can be very easily manipulated.

Friday, October 6, 2023

Bonds And Money

The US bond market is getting hammered lately as investors and traders realize that (a) the economy is not collapsing and (b) the Fed will keep rates high for longer than previously anticipated.

Money creation is THE driving force of consumer spending which is, by far, the most important component of US GDP. 

So, here is a chart of “money creation” via the Fed’s own balance sheet. Assets are now at 32% of GDP, up from 18% pre-COVID and just 6% before the Great Debt Crisis.

In both cases the government/Fed just threw money at the problem instead of handling it in a more constructive and structural fashion.  If the current situation evolves into yet another crisis, this time printing money will definitely create much bigger problems than it solves: to wit, hyperinflation and the end of empire.

The chart is another way to measure the devaluation of the dollar vs “real” assets and economic activity. The rest of the global economy is also “devaluing” (eg the EU/euro and recently Japan/yen) so as of yet there are no credible alternatives.  But watch out for China…


Monday, August 28, 2023

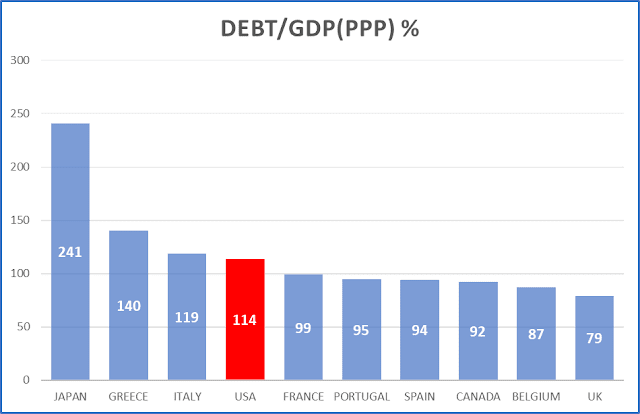
Debt To GDP For The US - We Have A Winner!

Note: Numbers on Debt/GDP below have been calculated using GDP on a Purchasing Power Parity (PPP) basis.  Also, I have removed countries such as Lebanon, Suriname, Sudan, etc. from the chart.

__________________________________________________________________________

When it comes to Debt/GDP Japan is the undisputed "champion" - but most all of its debt is domestic. Only 6.5% of all debt is owed to foreigners, while the vast majority (52%) is held by the Bank of Japan. This has significant global repercussions, but Japan is not my subject today.

Number two on the rogues list is Greece - no surprise there - but unlike Japan most all of its debt is owed to foreign official sector lenders. The bad news here is that this debt load exists even after the country went bankrupt a decade ago and plunged its economy into a decade long depression. But Greece is also not my subject today.

Numero tre is Italy.  A perennial problem child, the only reason Italy can still finance itself at reasonable interest rates is that its Eurozone membership is presumed to preclude a bankruptcy. Let me point out, however, that as recently as 2008 its debt/GDP(PPP) was ca. 70%.  But Italy, too, is not my subject today.

My subject today is the USA - not a shock to regular readers of this blog going back as far as 2006.  And my main question here is this: how logical, or even safe for the global economy, is it that the issuer of the world's reserve currency is so heavily in debt?  Indeed, what does this mean for the US dollar when its issuer is the world's #4 most indebted economy? 

Sure, under our current fiat currency regime, where debt is money and money is debt, it is expected that the availability of the global reserve currency can only come from a country that has a commensurately high debt.  

But at which point does the debt load finances mostly domestic consumer spending of cheap imports (eg China) and defense spending, instead of productive, high value added activities? At which point does the incessant printing/borrowing become a vicious cycle? 

Hint: the crypto boom is stoked to a large extent by those who look at such statistics and rub their hands in glee.  I do not share their glee because if we go down that route we are opening a much worse Pandora's Box - no need to enumerate all the nasty stuff that will come out from the Crypto Box.

But... something must be done to contain the US propensity to borrow and spend with abandon as if "tomorrow never comes, la, la, la".  Because, unlike in the song, tomorrow always comes.

Let me try to quantify the debt excess, even if roughly: the US accounts for approx. 16% of global GDP(PPP), but its government debt stands at ca. 35% of global government debt.  In other words, the US is twice as indebted when measured against its global economic size. 


Sunday, August 27, 2023

US Inflation And The Fed

 The one certainty from Mr Powell’s Jackson Hole speech a couple days ago is this: The Fed remains firmly committed to its 2% inflation target. Corollary: all policy decisions will stem from that.

I’ve put together a chart comparing headline, core and employment cost inflation - see below. My interpretation of the data is this: headline inflation may have come down sharply due to an outsize drop  in energy prices, but core and employment cost inflation are still more than double the Fed’s target.

Those expecting a quick reversal of high interest rates and restrictive monetary conditions (QT) are going to be very disappointed - unless a severe recession hits. Either way, not ideal for debt and equity markets.


Friday, August 25, 2023

Charting Tealeaves

 In my experience, charting as a market analysis tool is as useful as reading tealeaves.  But, occasionally it actually works, so when I have nothing better to do I look at charts for those familiar patterns which, purportedly, foretell the future.

I have nothing better to do right now (dog days of summer), so here's an annotated chart of SP500. The chart pattern is called an inverted flag (a bearish "trend continuation") and, theoretically, a downward breach of the flag signals a continued downward move to at least as low as the length of the pole from the point of the breach.

How do you take your tea? I recommend large doses of grains of salt... :) .  Nevertheless, as I said in my previous posts, the bond market - which I strongly believe is a very good warning indicator - is looking decidedly ugly, so maybe this time the tea leaves are issuing a valid reading.